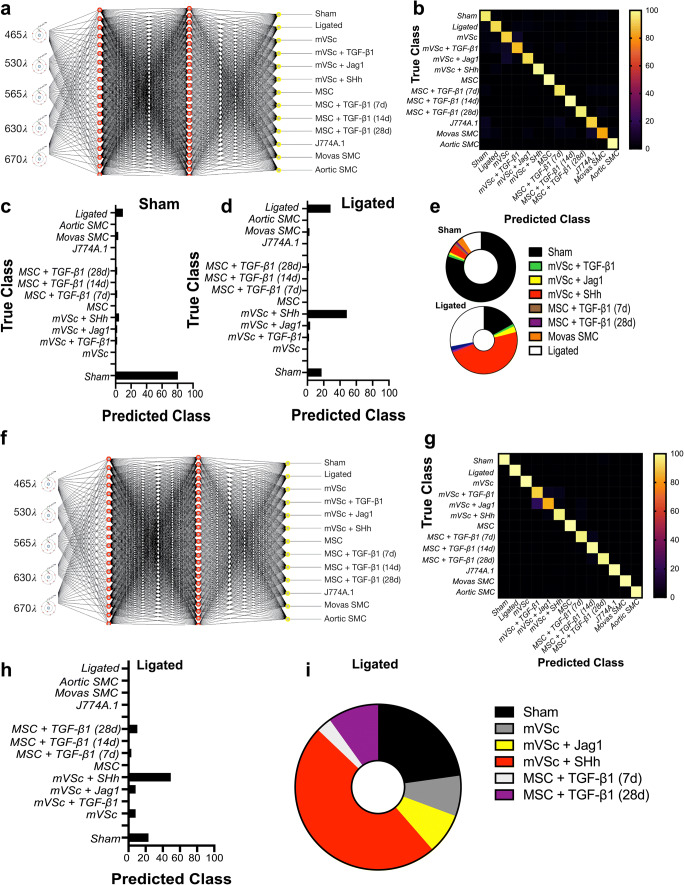
Fig. 9.
Supervised machine learning identifies S100β+mVSc-derived myogenic progeny within ligated vessels. (a). Graphic representation of the MLP neural network algorithm. (b). Confusion matrix of true class and predicted class of following training with (i) sham cells, (ii) ligated cells (iii) aortic SMCs, (iv) Movas SMCs, (v) J774A.1 macrophages, (vi) MSCs and their myogenic progeny and (vii) S100β mVSc and their myogenic progeny using MLP neural network analysis. (c-d). Percentage of cells in sham and ligated vessels classified using MLP neural network analysis on trained dataset. The trained dataset consisted of 924 cells across five wavelengths. The test dataset consisted of 78 cells across five wavelengths (e). Graphic representation of percentage of cells in sham and ligated vessels using MLP neural network analysis. (f). Graphic representation of the MLP neural network algorithm combining photonic signatures with indices of cell metabolism, lineage specific gene expression and structural gene expression to predict the cellular heterogeneity within vascular lesions. (g). Confusion matrix of true class and predicted class of following training with (i) sham cells, (ii) ligated cells (iii) aortic SMCs, (iv) Movas SMCs, (v) J774A.1 macrophages, (vi) MSCs and their myogenic progeny and (vii) S100β mVSc and their myogenic progeny using re-trained dMLP neural network analysis. (h). Percentage of cells in ligated vessels classified using MLP neural network analysis on re-trained dataset. The trained dataset consisted of 924 cells across five wavelengths. The test dataset consisted of 78 cells across five wavelengths (i). Graphic representation of percentage of cells in ligated vessels using MLP neural network analysis

