
FIGURE 4.
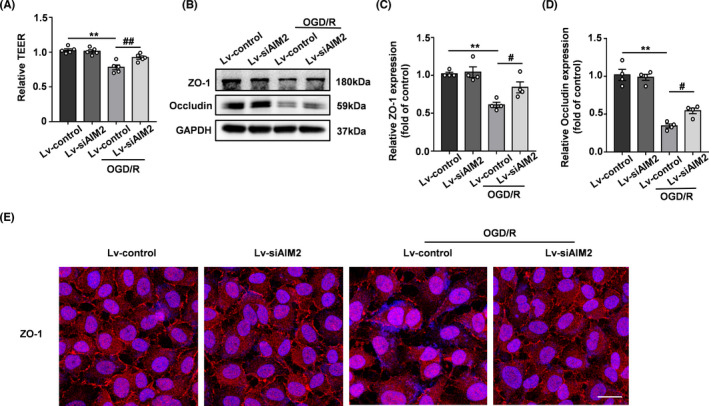
Silencing AIM2 rescued BBB breakdown after OGD/R in vitro. A, Quantification of transendothelial permeability as determined by the TEER assay (n=5). B, Western blot analysis of ZO‐1, occludin, and GAPDH after OGD/R. C, D, Quantification of the protein levels of ZO‐1 and occludin normalized to those of GAPDH. E, Representative immunofluorescence images of DAPI (blue)/ZO‐1 (red) colocalization after OGD/R. Scale bar: 20 μm. All data are presented as the mean ±SEM. ** p < 0.01 compared with the control group. # p < 0.05 and ## p < 0.01 compared with the OGD/R‐control group