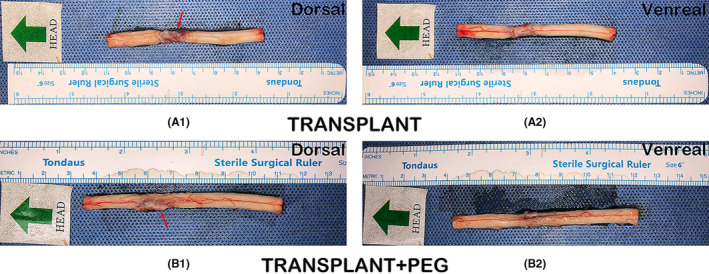
FIGURE 2.

Spinal cord sample. A1 (dorsal) and A2 (ventral) show images from the TRANSPLANT group. It can be seen that there is a glial scar in A1, as indicated by the red arrow. B1 (dorsal) and B2 (ventral) show images of the TRANSPLANT+PEG group. The shape of the transplanted spinal cord was basically the same as that of the normal spinal cord. However, the other half of the gap consisted of a glial scar (red arrow in B1)
