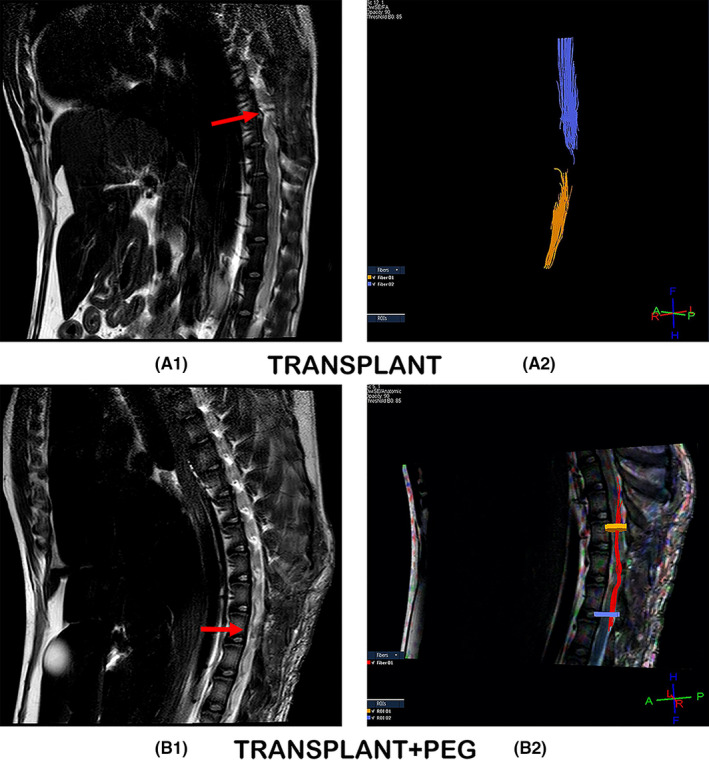
FIGURE 4.

T2W and DTI. T2‐weighted MRI scans showing tissue re‐establishment of anatomic continuity in the TRANSPLANT+PEG group (red arrow in B1) in contrast to no such continuity in the TRANSPLANT group (red arrow in A1). DTI, which allows for the measurement of the integrity of nerve fiber tracts, showed fiber regrowth across the plane of transection in the TRANSPLANT+PEG group (B2), versus no such regrowth in the TRANSPLANT group (A2)
