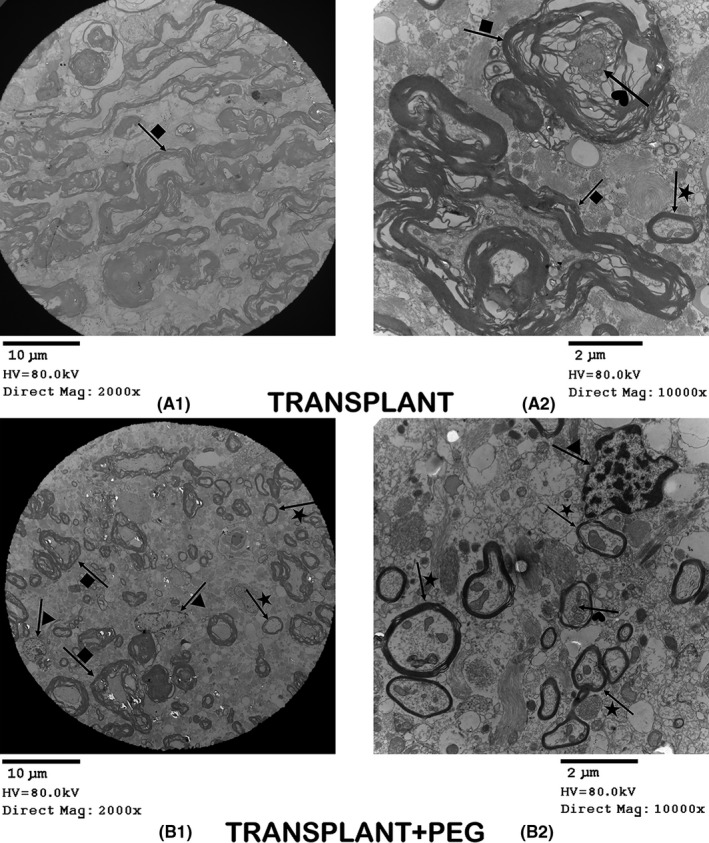
FIGURE 5.

Transmission electron microscopy. In the TRANSPLANT+PEG group, we can see a large amount of new myelin (arrow + star in B1 and B2) and a small number of demyelinated axons (arrow + square in B1). In contrast, in the TRANSPLANT group, there is a lot of demyelinated myelin (arrow + square in A1 and A2), but less new myelin (arrow + star in A2). In the TRANSPLANT group, we see only few oligodendrocytes; while in the TRANSPLANT+PEG group, there are a large number of oligodendrocytes (arrow + triangle in B1 and B2). There is a clear contrast between the axons of the two groups: the axons of the TRANSPLANT group are atrophied (arrow + heart in A2), while those of the TRANSPLANT+PEG group are healthy (arrow + heart in B2)
