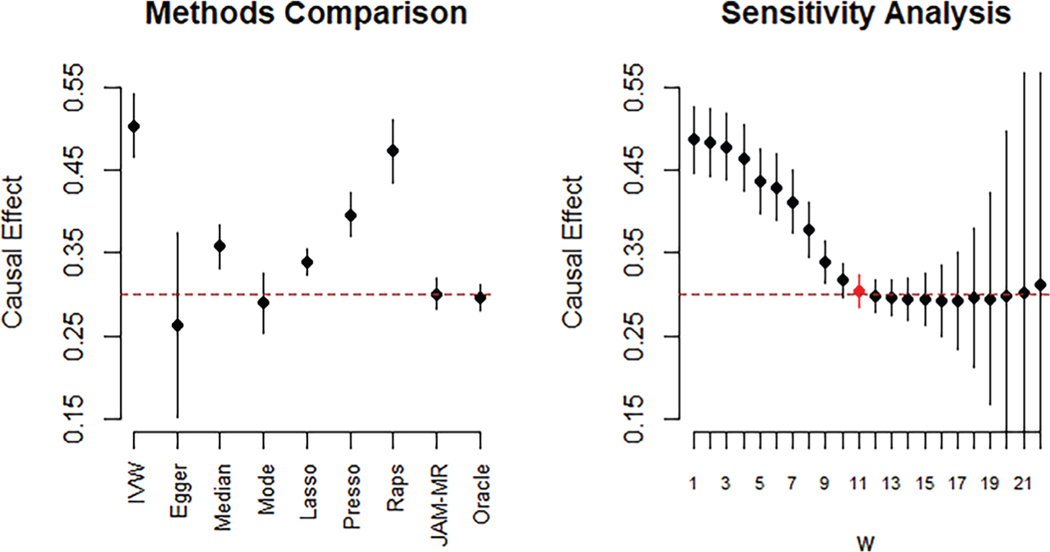
FIGURE 2.
Simulation scenario 2: Directional pleiotropy, InSIDE satisfied (𝜃 = 0.3). Causal effect estimates and 95% confidence intervals for various Mendelian randomization algorithms (left) and JAM-MR with a range of w values (right). The dashed line at 0.3 represents the true causal effect [Colour figure can be viewed at wileyonlinelibrary.com]

