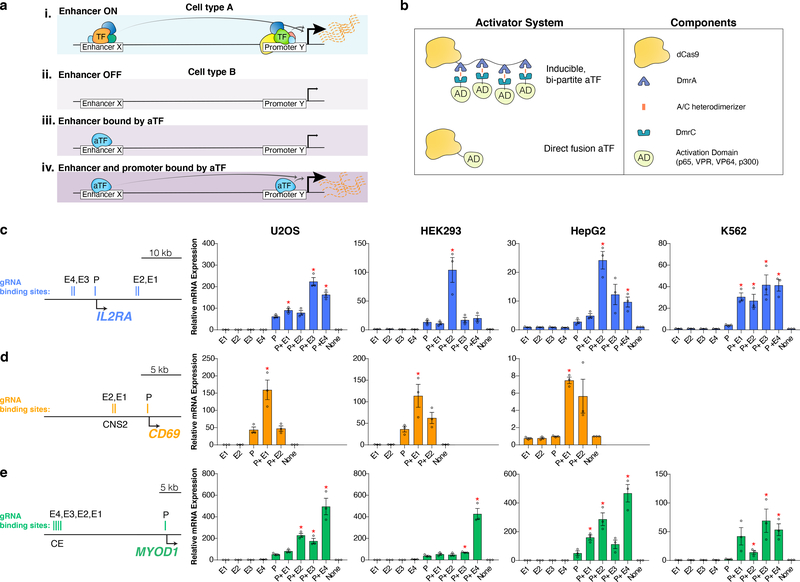
Figure 1. Heterotopic activation of enhancer sequences by dCas9-based aTFs in multiple human cell lines.
a, Schematics illustrating: (i) an enhancer X that activates promoter Y in cell type A, (ii) lack of enhancer X activity on promoter Y in a different cell type B, (iii) lack of enhancer X activity on promoter Y in cell type B when an aTF is recruited only to enhancer X, and (iv) robust enhancer X activity on promoter Y in cell type B when aTFs are recruited to both enhancer X and promoter Y.
b, Architectures of dCas9-based bi-partite and direct fusion aTFs used in this study.
c-e, mRNA expression levels of the endogenous IL2RA, CD69 and MYOD1 genes in human cell lines in the presence of the bi-partite p65 aTF and one or more gRNAs targeting enhancer (E1, E2, E3, or E4) or promoter (P) sequences. Relative expression of each gene was measured by RT-qPCR, normalized to HPRT1 levels and calculated relative to that of a control sample (None) expressing a non-targeting gRNA. Open circles indicate biological replicates (n=3), bars the mean of replicates, and error bars the s.e.m. * indicates significantly different from the sample targeting only the promoter, p<0.05 (Student’s t-test, two-tailed test assuming equal variance). The exact p-values are in Source Data for Fig. 1.

