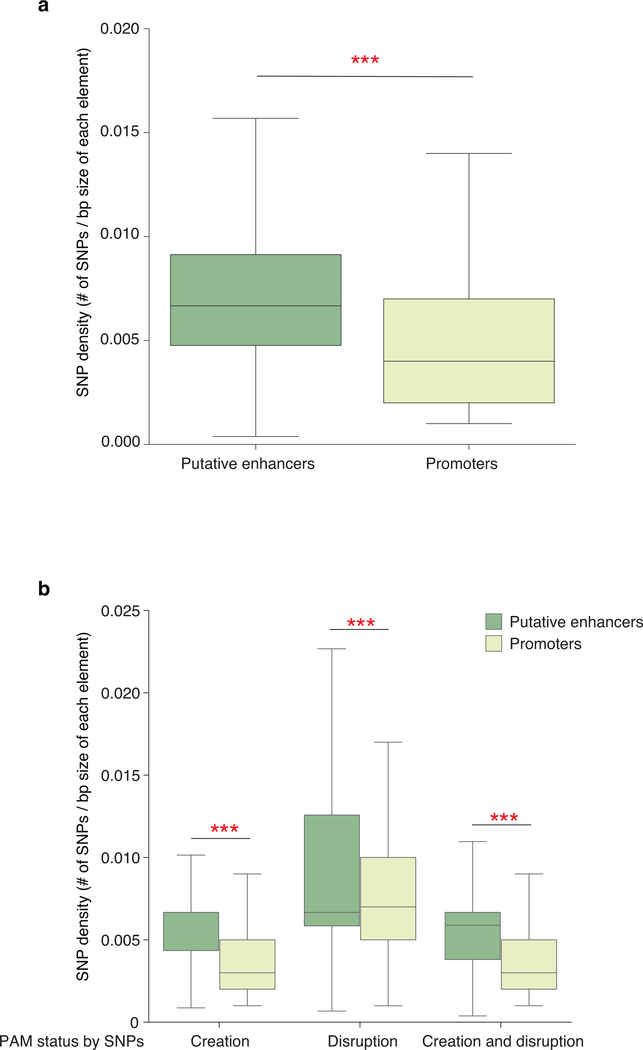
Extended Data Fig. 8. Distribution of SNP densities that create or disrupt NGG PAM sequences at putative enhancers and promoters.
The density of SNPs is the number of SNPs divided by the base pair size of each regulatory element (promoter or enhancer) identified from the 1000 Genomes Project using DHS data from 83 different cell lines from ENCODE/Roadmap project. center line, median; box limits, upper and lower quartiles; whiskers, 1.5x interquartile range. * indicates p<0.001 (Mann-Whitney U test (two-sided) with Bonferroni test for multiple comparison)

