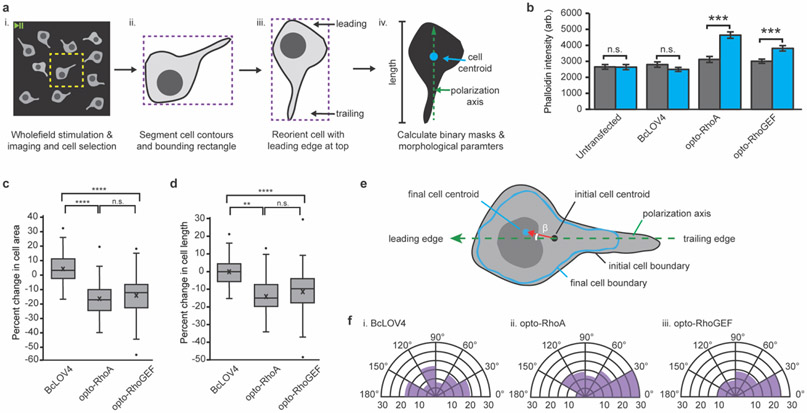
Figure 2.
Optogenetic induction of contractility in response to unpatterned wholefield stimulation. a. Image analysis workflow. (i) Whole FOV videos cropping (yellow) to contain one cell. (ii) Cell contour (black) and bounding rectangle (purple) definition from the initial frame. (iii) Iterative cell rotation (5° increments). The angle that maximizes rectangle height and positions the nucleus closer to the top (as a leading edge marker, see Supplementary Figure 5) is applied to all frames to align the y-axis with the cell polarity. (iv) Binary mask creation for initial and final timepoints for calculating cell areas, centroids, and lengths. B. Phalloidin stain intensity in dark-adapted vs. stimulated cells. Mean +/− standard error. N = 40 cells per condition. C. Box-and-whisker plot of cell area change upon wholefield stimulation. D. Box-and-whisker plot of cell length change upon wholefield stimulation. N = 82-93 cells per condition. E. Schematized calculation of angle of cell movement. Centroids of the initial (red) and final (blue) cell boundaries are calculated in OpenCV (moments function). The angle of movement between the cell polarization vector (green, dashed) and the centroid movement vector (red) is designated as β. F. Circumplex charts of the angle of movement relative to the polarization vector in cells expressing (i) BcLOV4, (ii) opto-RhoA, and (iii) opto-RhoGEF. N = 82-93 cells per condition. b-d. Two-sided Mann-Whitney U test: (**) p < 0.01; (***) p < 0.001; (****) p < 0.0001; (n.s.) not significant. c-d. Center line, median; “X”, mean; box limits, upper and lower quartiles; whiskers, 1.5x interquartile range; points, outliers.

