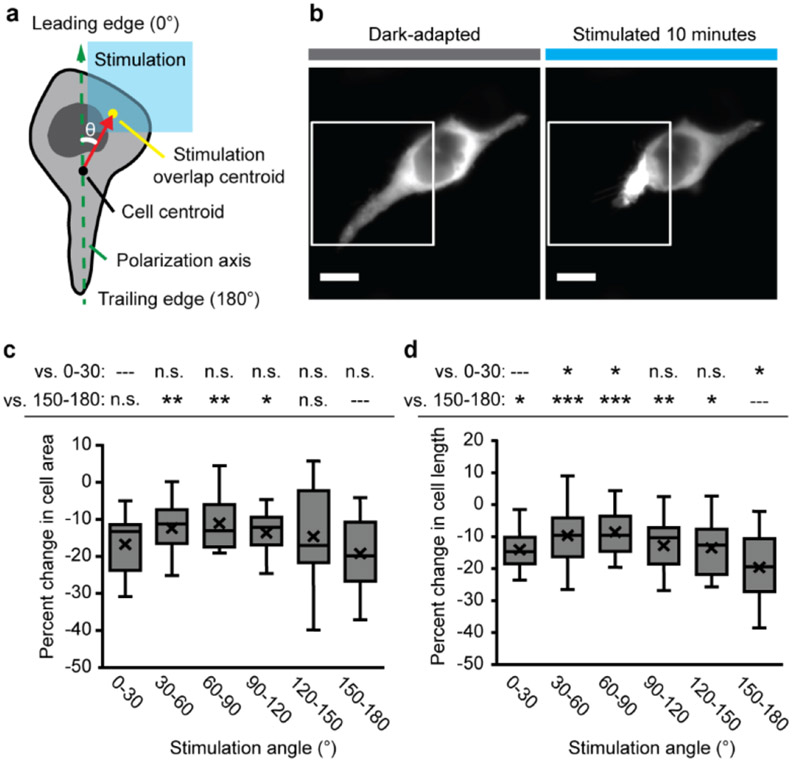
Figure 3.
Stimulation angle dependence of opto-RhoA-driven contraction. a. Schematic of stimulation angle (θ) calculation from the polarization axis, cell centroid, and centroid of the overlap region of the cell with the patterned stimulation field. b. Exemplar images of focal contraction of the trailing edge of a HEK cell after 10 minutes of pulsatile patterned stimulation (1.6% duty ratio). White box = illumination field. Scale = 10 μm. c. Box-and-whisker plot of change in cell area (relative to initial area) for binned stimulation angles. d. Box-and-whisker plot of change in cell length (relative to initial length) for binned stimulation angles. c-d. N = 10-35 independent videos per bin. Two-sided Mann-Whitney U test: (*) p < 0.05; (**) p < 0.01; (***) p < 0.001; (n.s.) not significant. Top row = vs. 0-30° leading edge bin; bottom row = vs. 150-180° trailing edge bin. Center line, median; “X”, mean; box limits, upper and lower quartiles; whiskers, 1.5x interquartile range.

