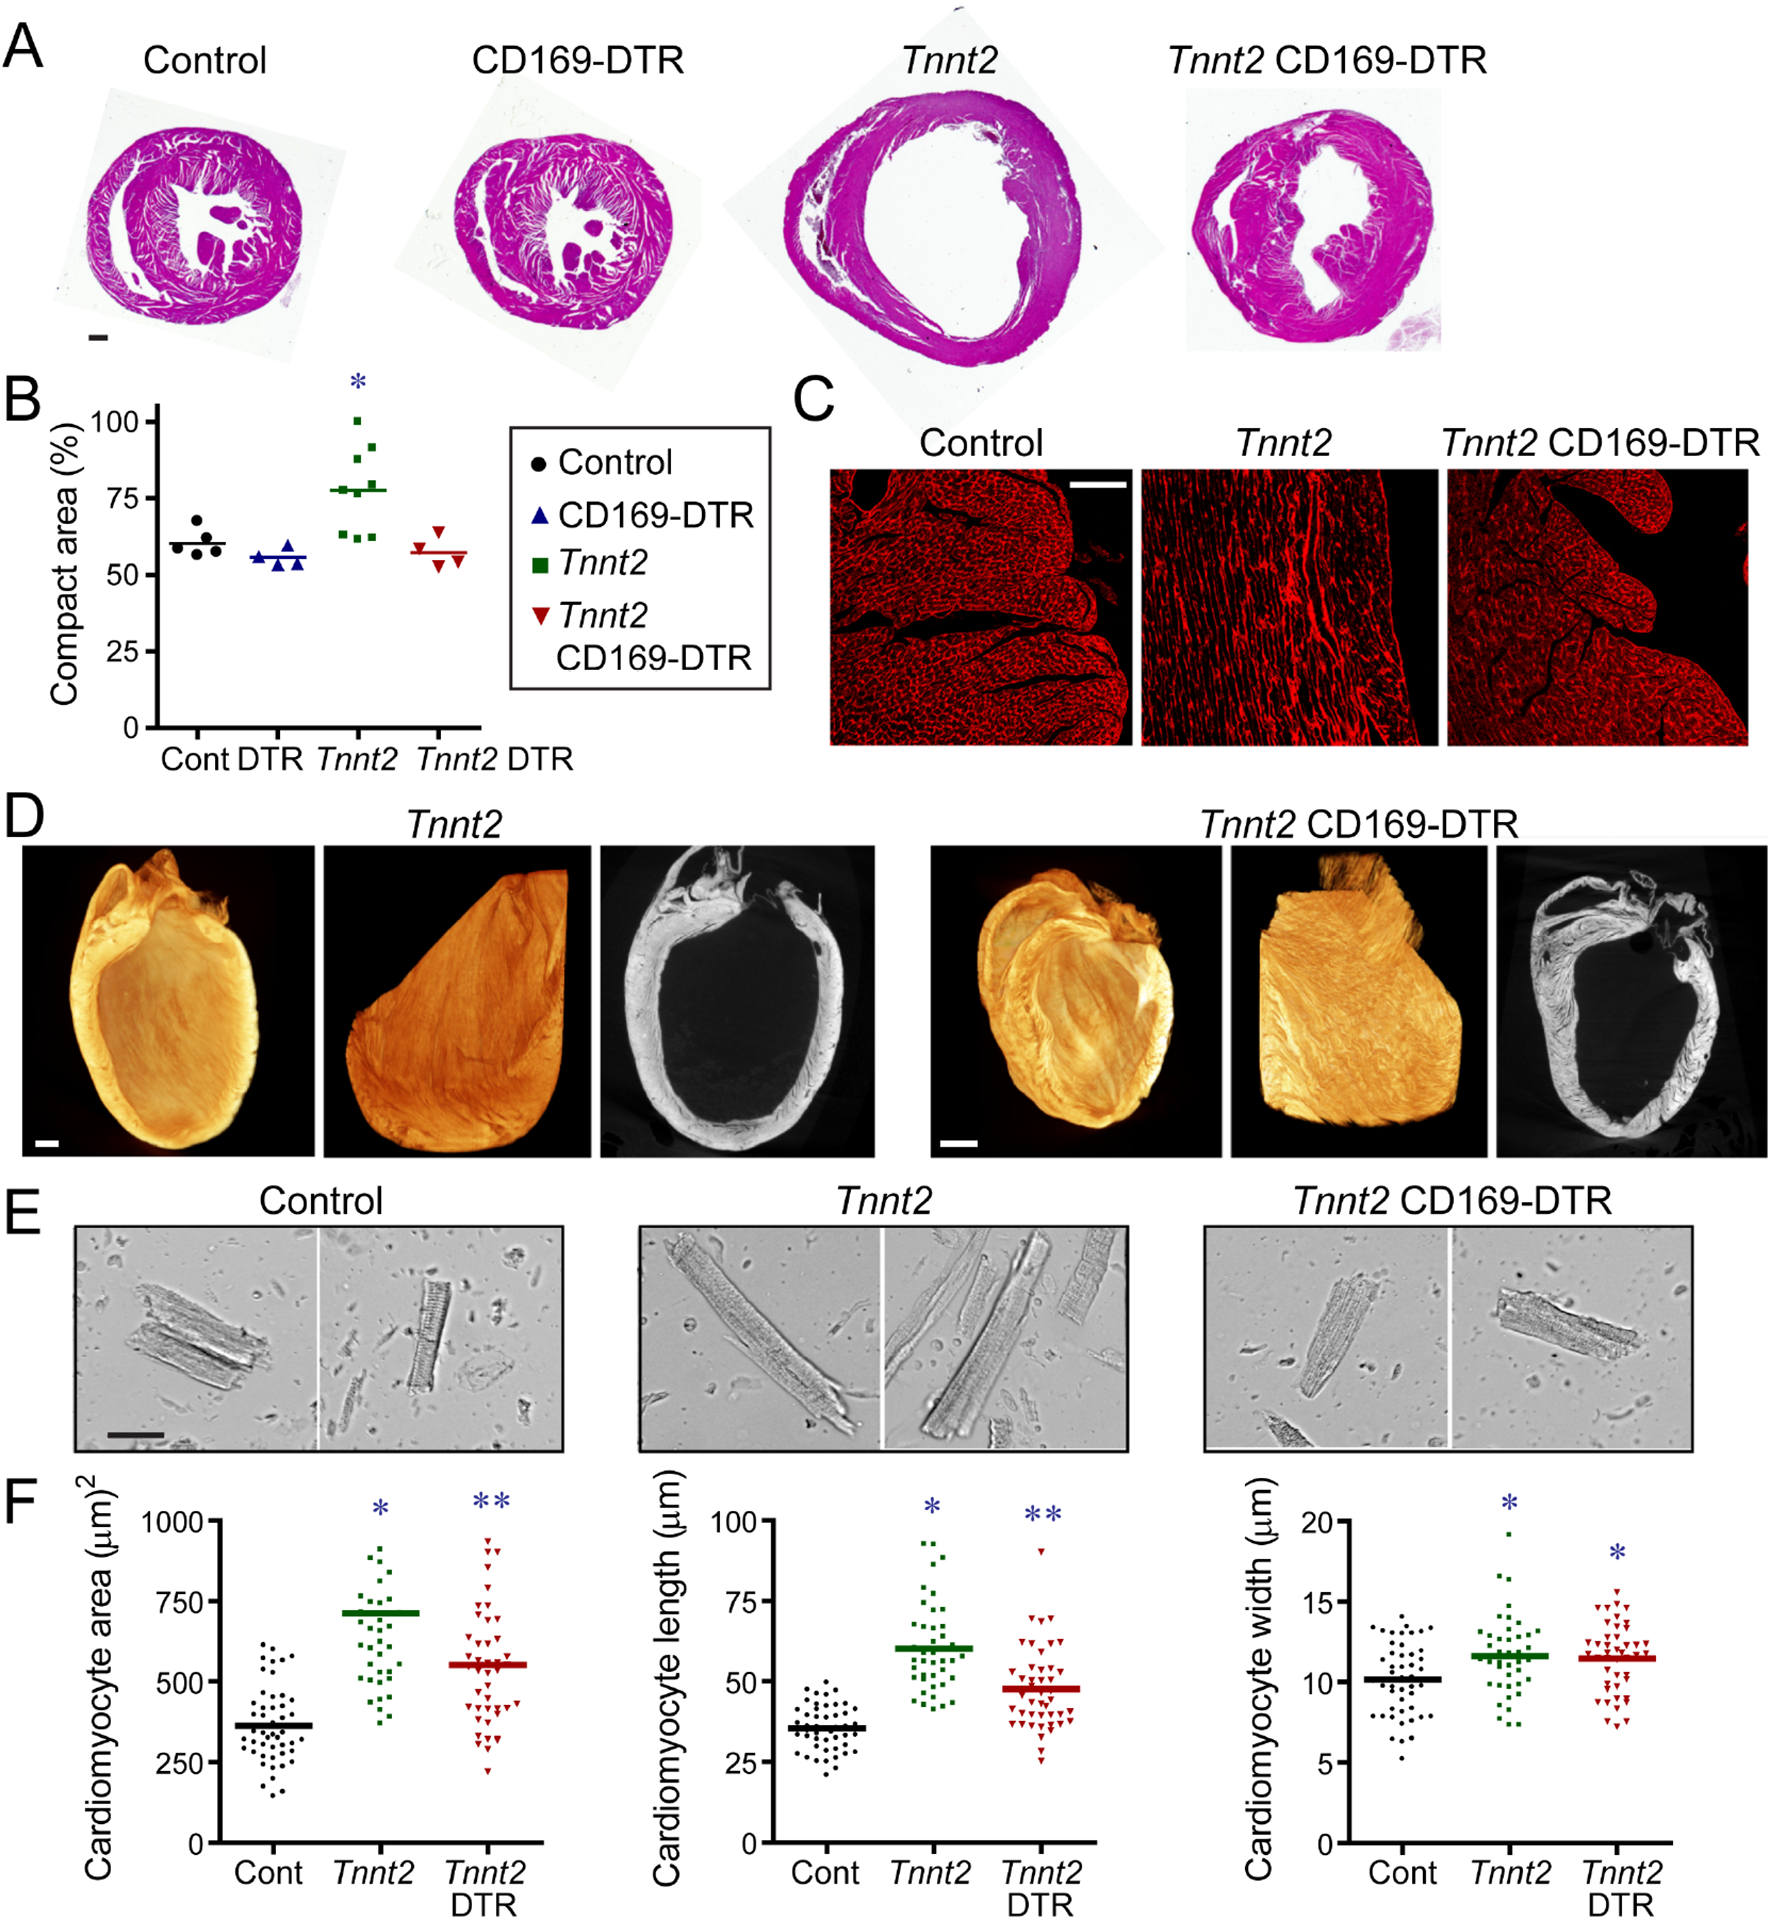
Figure 3. CCR2− macrophages orchestrate myocardial tissue adaptations in dilated cardiomyopathy.

A, Low magnification H&E images of control, CD169-DTR, Tnnt2ΔK210/ΔK210, and Tnnt2ΔK210/ΔK210 CD169-DTR hearts after 3 weeks of DT treatment. n=4–9 per group. Scale bar: 200μm. B, Quantification of the ratio of compact to trabecular myocardium in control, CD169-DTR, Tnnt2ΔK210/ΔK210, and Tnnt2ΔK210/ΔK210 CD169-DTR hearts. C, Wheat germ agglutinin (WGA, red) staining showing alignment of trabecular cardiomyocytes in control, Tnnt2ΔK210/ΔK210, and Tnnt2ΔK210/ΔK210 CD169-DTR hearts. n=4–9 per group. Scale bar: 40μm. D, X-ray microscopy and virtual histology images comparing myocardial architecture of Tnnt2ΔK210/ΔK210 and Tnnt2ΔK210/ΔK210 CD169-DTR hearts following 3 weeks of DT injection. n=4 per group. Scale bar: 200μm. E, Images of cardiomyocytes digested from control, Tnnt2ΔK210/ΔK210, and Tnnt2ΔK210/ΔK210 CD169-DTR hearts. Hearts were relaxed in potassium prior to fixation. Scale bar: 20μm. F, Quantification of cardiomyocyte area, length, and width. * denotes p<0.05 (ANOVA, Post-hoc Tukey) compared to controls. ** denotes p<0.05 compared to control and Tnnt2ΔK210/ΔK210 mice. See also Figure S4.
