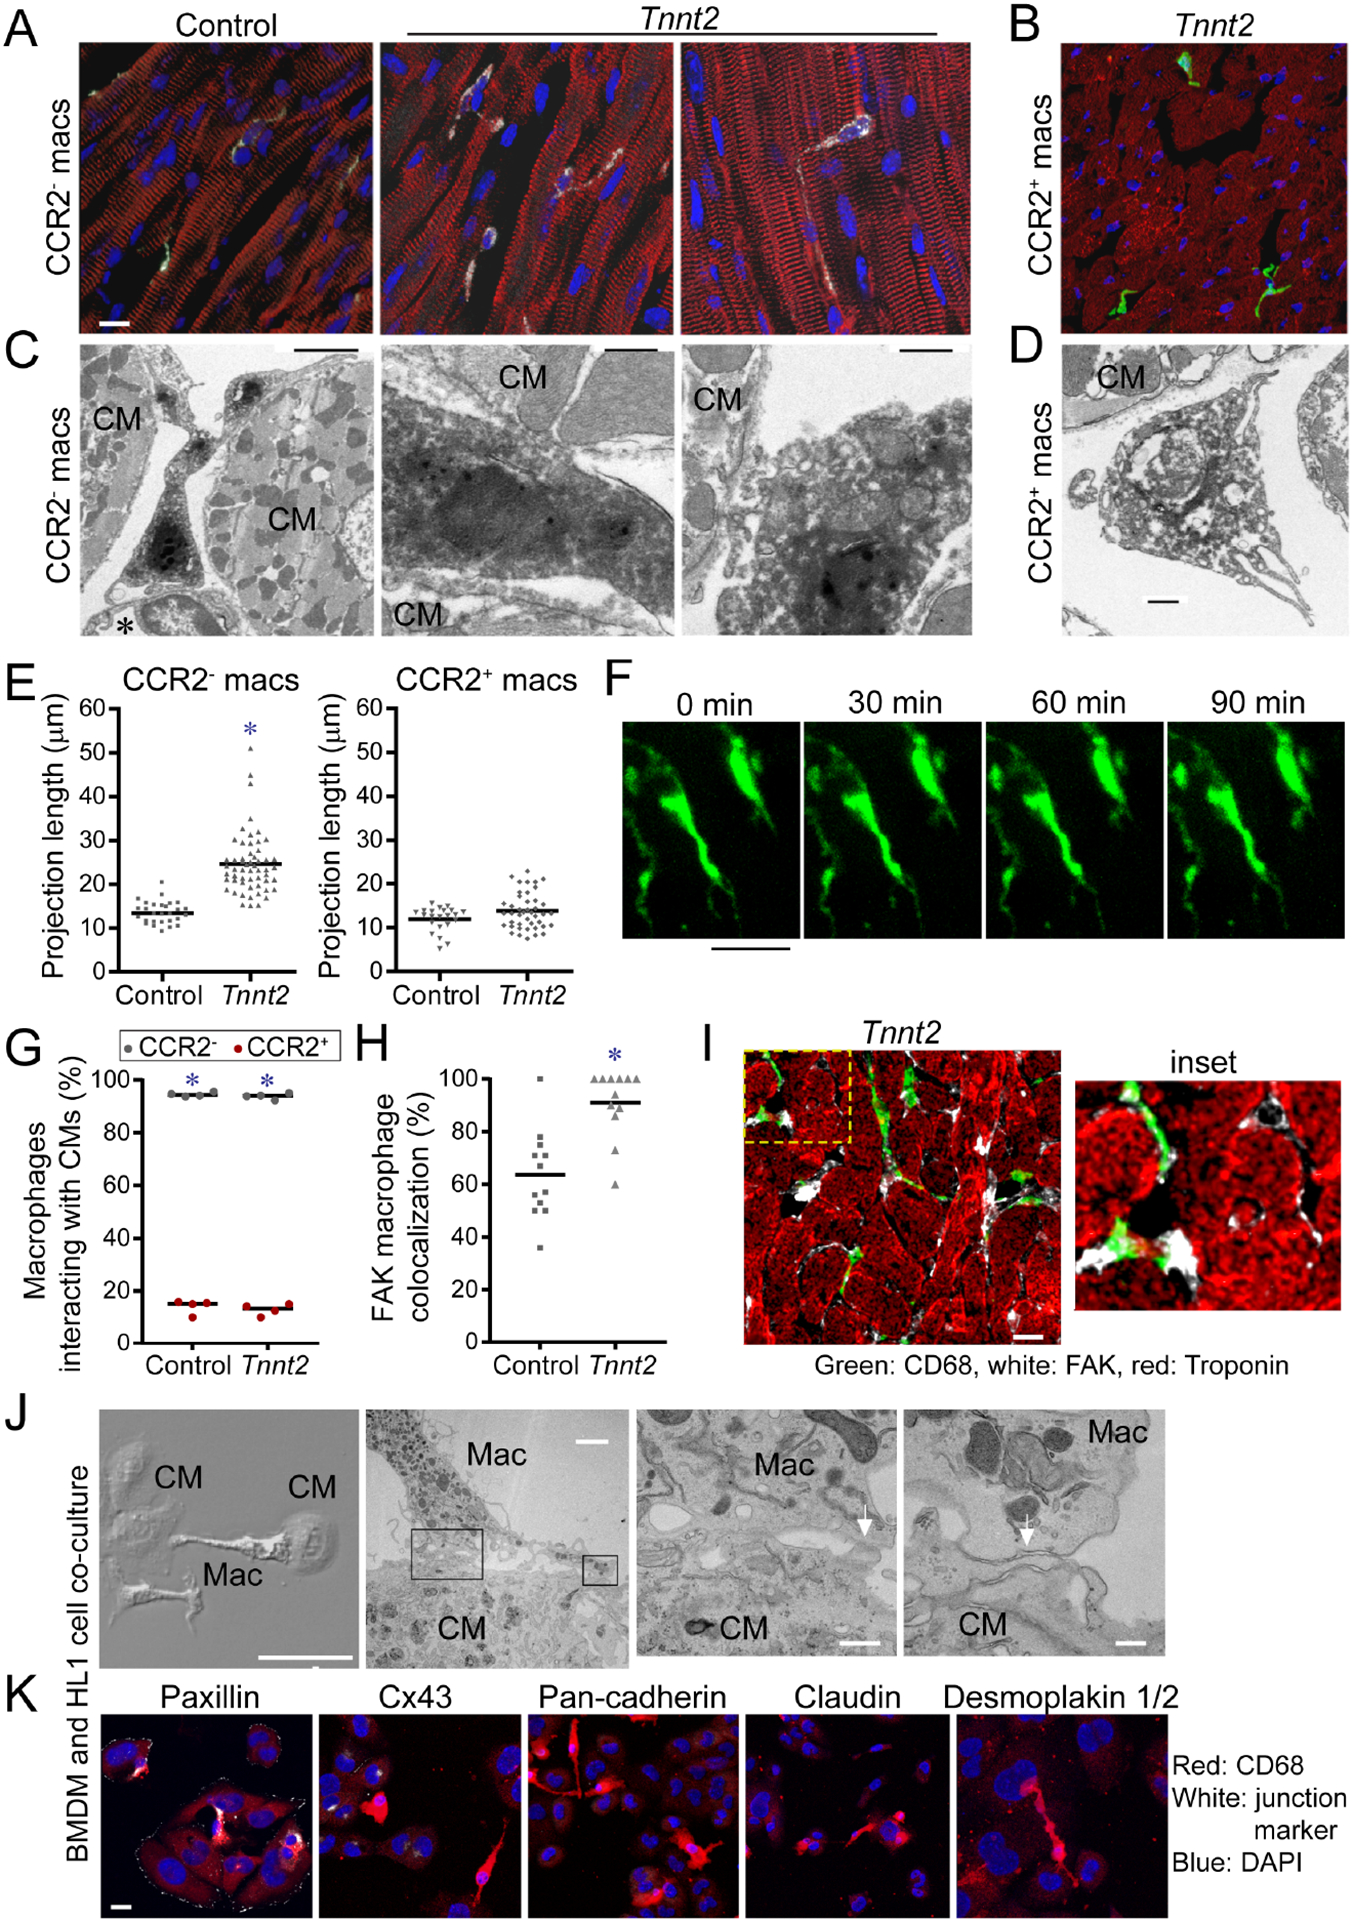
Figure 5. CCR2− macrophages interact with neighboring cardiomyocytes through focal adhesion complexes.

A-B, Compressed Z-stack images of CCR2− (A) and CCR2+ (B) cardiac macrophages of a 8-week-old control Ccr2GFP/+ and Tnnt2ΔK210/ΔK210 Ccr2GFP/+ hearts. n=4–6 per group. CD68: white, GFP: green, α-actinin, red, DAPI: blue. Scale bar: 10μm. C-D, Electron microscopy of CCR2− (C) and CCR2+ (D) cardiac macrophages in Tnnt2ΔK210/ΔK210 Ccr2GFP/+ hearts. CCR2− macrophage are adjacent to endothelial cells (*) and contact cardiomyocytes (CM). n=4 per group. Scale bars: 2μm (C, left), 500nm (C, center; C, right, D). E, Measurement of projection length in CCR2− and CCR2+ macrophages of 8-week-old Ccr2GFP/+ and Tnnt2ΔK210/ΔK210 Ccr2GFP/+ hearts. * denotes p<0.05 (Mann-Whitney test) compared to controls. F, 2-photon microscopy of live Cx3cr1GFP/+ Ccr2RFP/+ papillary muscle cell preparations (n=4) over 90 minutes. CCR2− macrophages (green). Scale bar: 25μm. G, Quantification of the percent of CCR2− (black data points) and CCR2+ (red data points) macrophages interacting with cardiomyocytes in control and Tnnt2ΔK210/ΔK210 hearts. n=4 per group. * denotes p<0.05 (Mann-Whitney test) comparing CCR2− to CCR2+ macrophages. H-I, Immunostaining for CD68 (green), FAK (white), and troponin (red). Scale bar: 10μm. n=12 per group. * denotes p<0.05 (Mann-Whitney test) compared to controls. J, Electron microscopy of bone marrow-derived macrophages (MΦ) and HL1 cardiomyocytes (CM) after 4 hours of co-culture. Physical interactions (white arrows) between macrophages and cardiomyocytes. Right center right panels: high magnification of boxed areas shown in left center panel. Scale bars: 50μm, 2μm, 500nm, 200nm. K, Immunostaining of cell junction markers. Blue-DAPI, red-CD68, white-cell junction markers: Paxillin (focal adhesion complex) Cx43 (gap junction), pan-Cadherin (adherins junction), Claudin (tight junction), Desmoplakin I/II (desmosome). Representative images from 4 independent experiments. Scale bar: 10μm. See also Figure S6, Supplemental movie 1–2.
