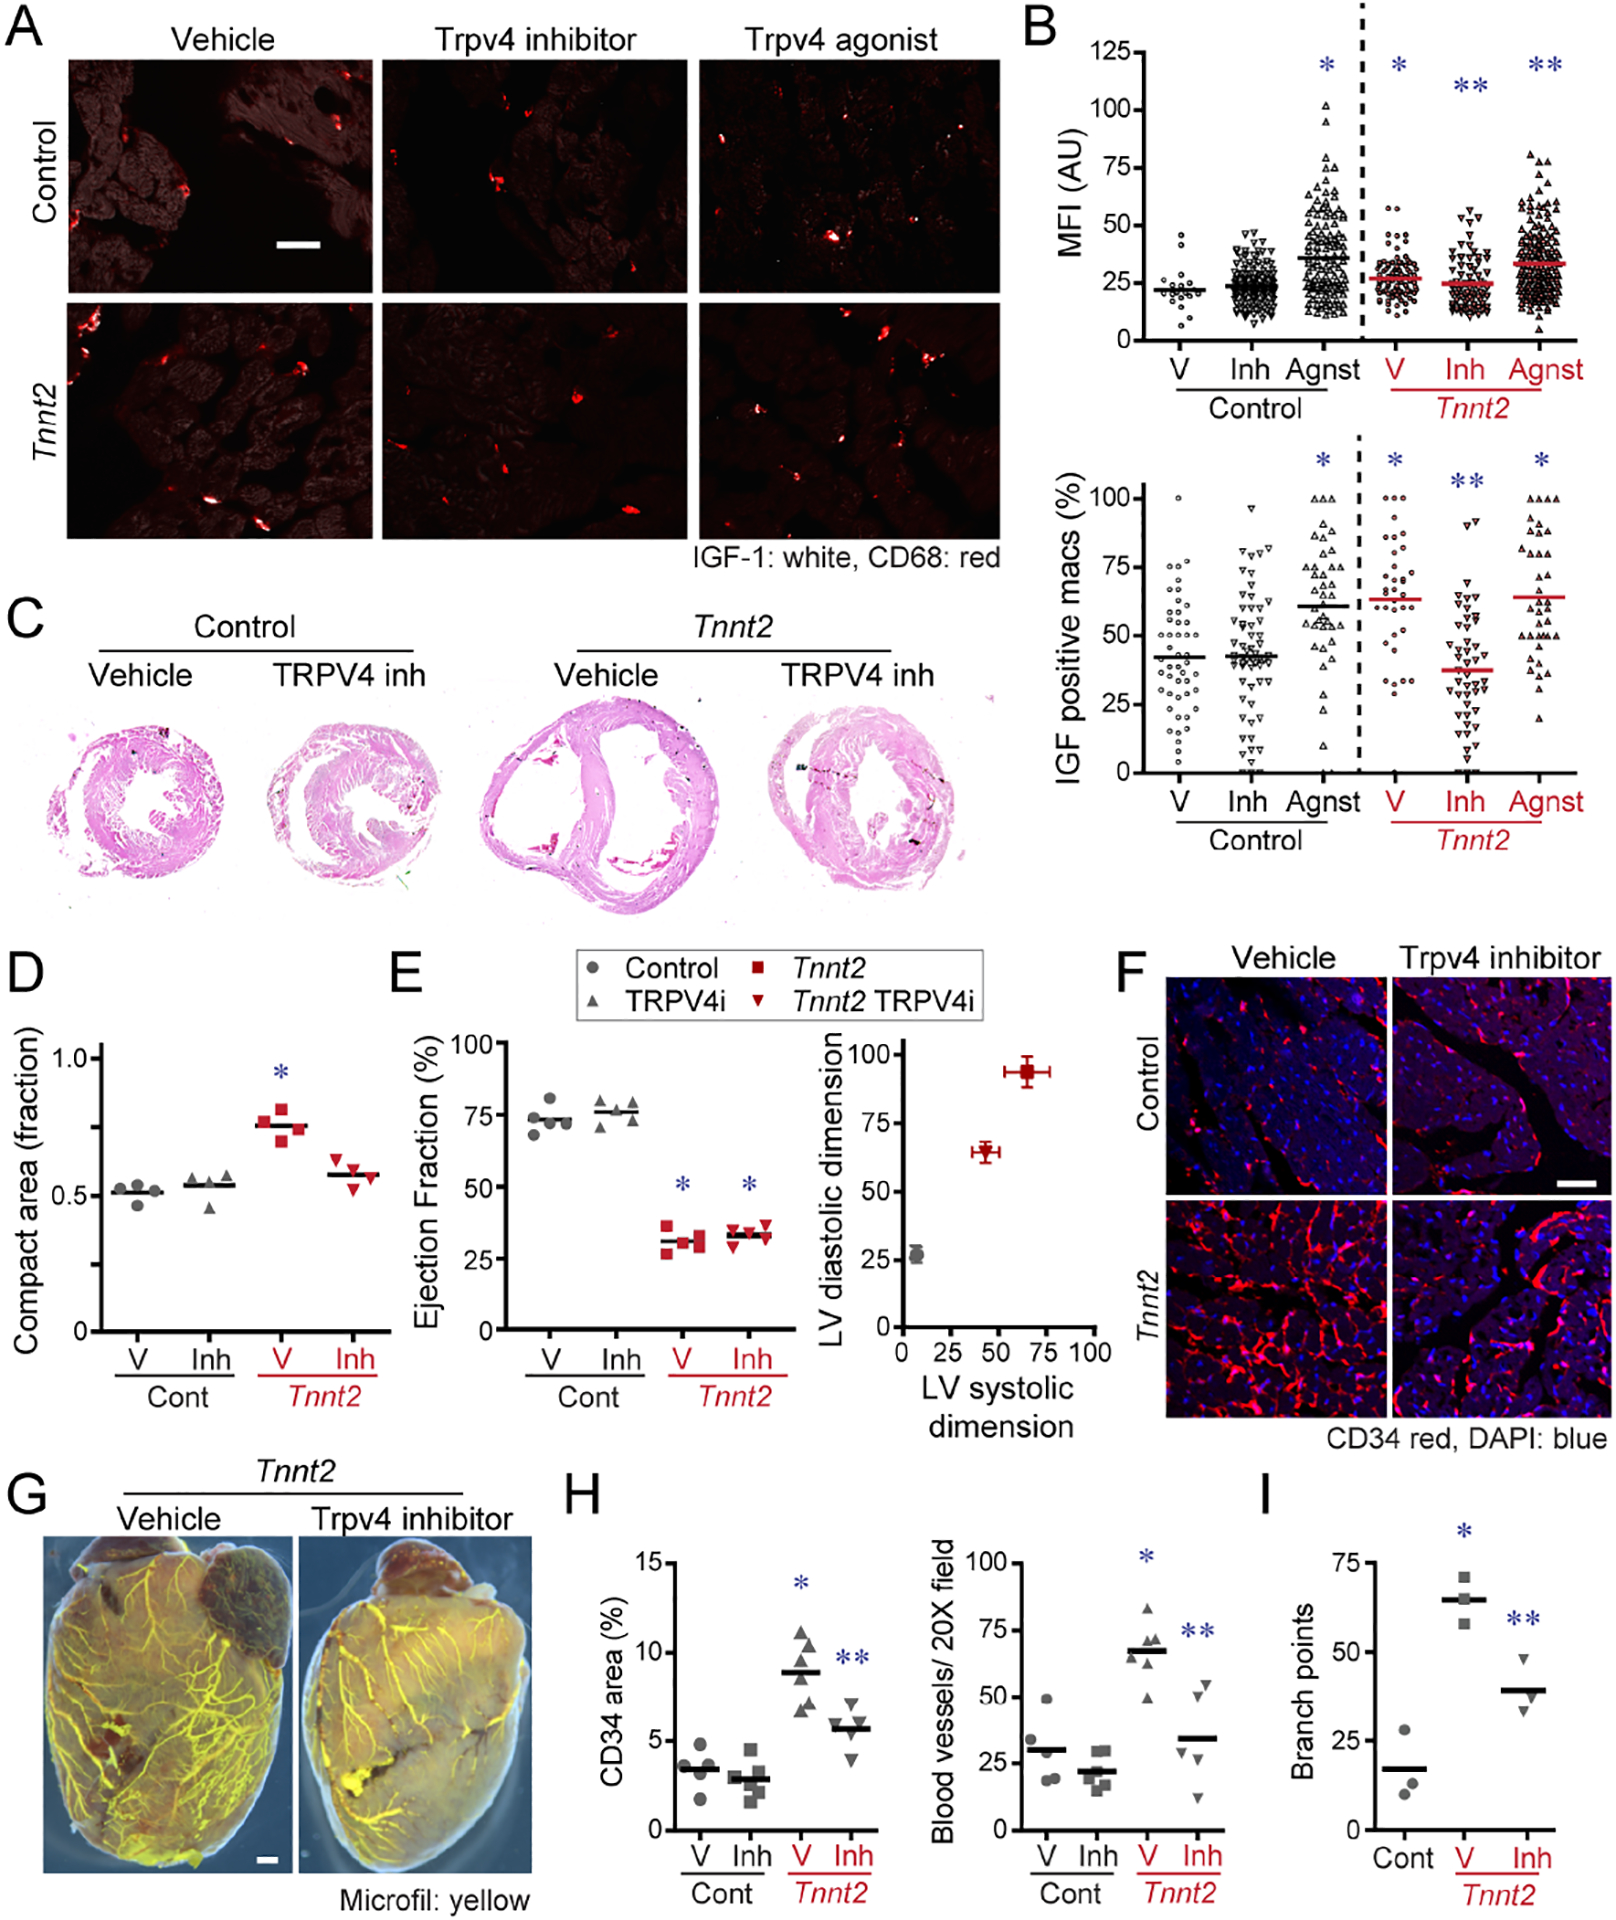
Figure 7. TRPV4 regulates IGF1 expression in CCR2− macrophages and is required for coronary angiogenesis.

A, Immunostaining for IGF1 (white) and CD68 (red) inf control and Tnnt2ΔK210/ΔK210 hearts treated with vehicle, TRPV4 inhibitor, or TRPV4 agonist. Scale bar: 20μm. B, Quantification of IGF1 protein expression (% IGF1+ macrophages, IGF1 MFI) in control and Tnnt2ΔK210/ΔK210 hearts treated with vehicle, TRPV4 inhibitor, or TRPV4 agonist. MFI: mean florescent intensity. n=5 per group. * denotes p<0.05 compared to vehicle treated control hearts. ** denotes p<0.05 compared to vehicle treated Tnnt2ΔK210/ΔK210 hearts. (ANOVA, post-hoc Tukey). C, Low magnification H&E images of control and Tnnt2ΔK210/ΔK210 hearts treated with vehicle or TRPV4 inhibitor for 2 weeks beginning at 6 weeks of age. n=4 per group. Scale bar: 200μm. D, Quantification of the ratio of compact to trabecular myocardium in control and Tnnt2ΔK210/ΔK210 hearts treated with vehicle or TRPV4 inhibitor. * denotes p<0.05 compared to vehicle treated control hearts (ANOVA, post-hoc Tukey). E, LV ejection fraction and LV chamber dimensions in control and Tnnt2ΔK210/ΔK210 mice treated with vehicle or TRPV4 inhibitor for 2 weeks beginning at 6 weeks of age. n=5 per group. * denotes p<0.05 compared to vehicle treated control hearts (ANOVA, post-hoc Tukey). F, CD34 (red) immunostaining of control and Tnnt2ΔK210/ΔK210 hearts treated with vehicle or TRPV4 inhibitor. Scale bar: 40μm. G, Microfil vascular casting showing that TRPV4 is necessary for expansion of coronary microvasculature in Tnnt2ΔK210/ΔK210 hearts. Scale bar: 200μm. H-I, Quantification of coronary microvasculature (G) and coronary microvasculature (H). n=5 per egroup. * denotes p<0.05 compared to vehicle treated control. ** denotes p<0.05 compared to all other groups (ANOVA, Post-hoc Tukey).
