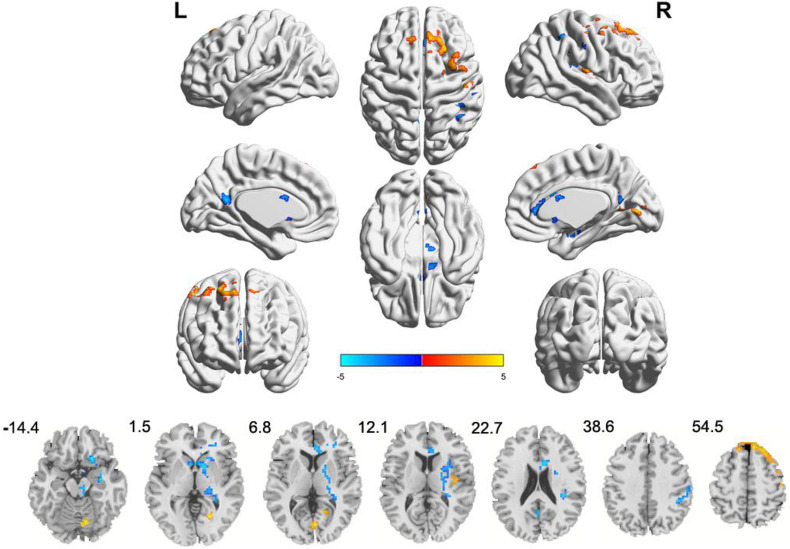
FIGURE 1.
Clusters showing ALFF changes in IBS-D patients as compared to that in healthy controls (TFCE, FWE-corrected P < 0.05). Blue color denotes relatively lower ALFF values in IBS-D group, red color denotes relatively higher ALFF values in IBS-D group, and the color bar in dicates the t-value from two-sample t-test between IBS-D group and HCs. L, left; R, right.

