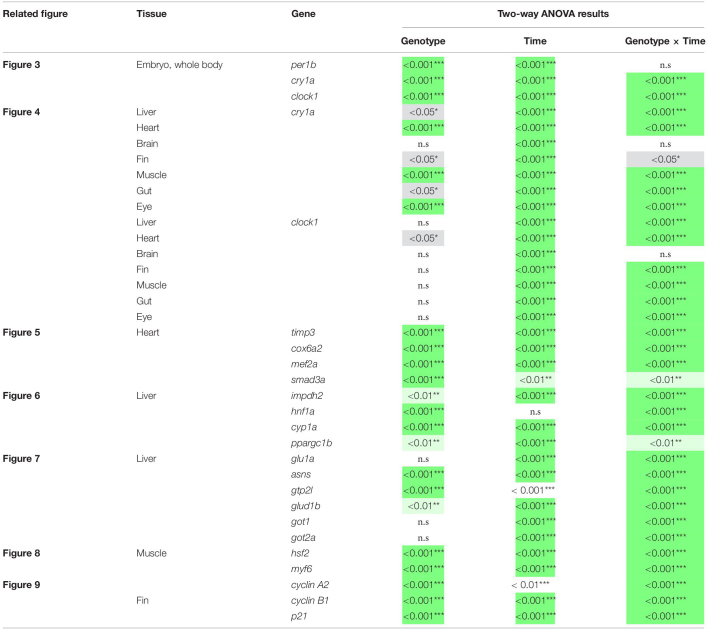
TABLE 1.
Under LD conditions, the per2 knockout alters circadian rhythms of mRNA expression in (i) CCGs in the liver, heart, fins, muscles, gut and eyes (Figure 4), (ii) clock-controlled genes in the heart (Figure 5), (iii) regulators of key physiological hepatic processes in the liver (Figure 6), (iv) genes encoding enzymes involved in biosynthesis of non-essential amino acids in the liver (Figure 7), (v) regulators of skeletal muscle myogenesis and regeneration in the muscles (Figure 8), and in (vi) cell-cycle regulators in the fin (Figure 9).
qRT-PCR was used to measure mRNA expression levels across five time points at 6 hourly intervals. Significance in the difference in gene expression dynamics between mutants and controls was assessed via a two-way ANOVA, fitted independently for each gene in each tissue. The ANOVA model consisted of three fixed effects: genotype (per2 KO or WT siblings), time, and their interaction genotype × time. A significant interaction indicates an alteration in the gene’s expression dynamics in the mutants. A significant genotype effect indicates difference in the gene’s average expression between the mutants and the controls across all time points. A significant time effect was exhibited in all tissues in almost all genes, indicating unsurprisingly that the expression over time is non-constant. The exception is hnf1a in the liver (Figure 6), whose rhythmic expression was maintained in the mutants, but with a 12 h phase-shift. No effect of per2 knockout on the circadian rhythm was observed in whole-body mRNA expression of the CCGs per1, cry1a and clock1 in embryos (Figure 3), as well as expression of cry1a and clock1 in adult brains. Darker green shading donotes calculated p values of <0.001, light green shading denotes p < 0.01 and grey shading denotes p < 0.05 (***p < 0.001, **p < 0.01, *p < 0.05).

