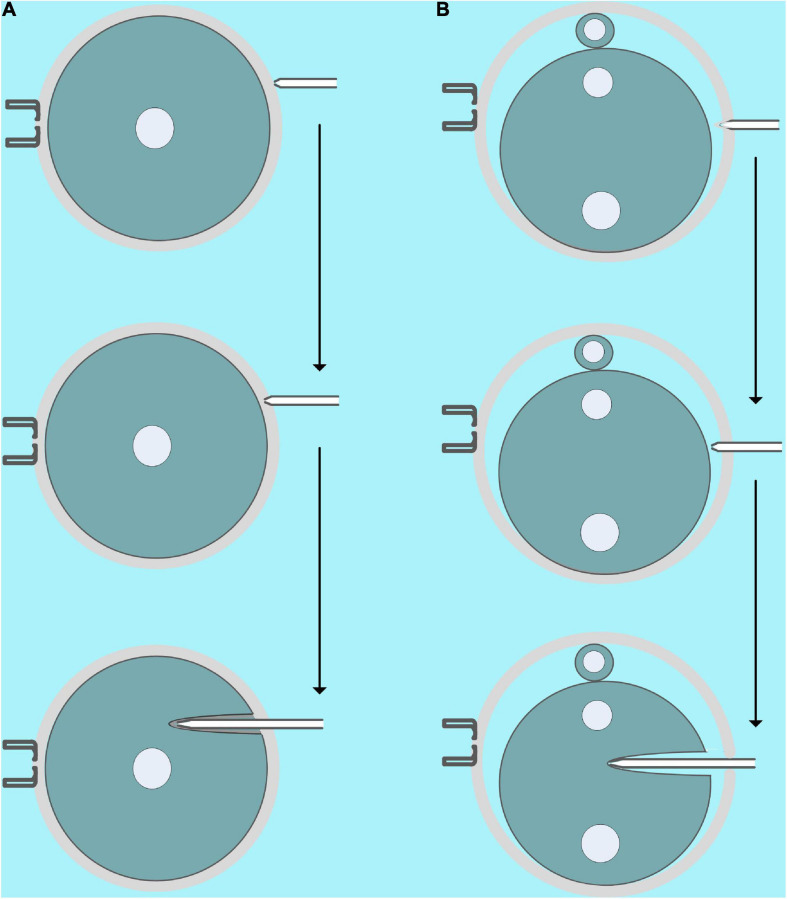
FIGURE 4.
Schematic diagram of microinjection. (A) Microinjection diagram of GV oocytes [microinjection of cumulus–oocyte complex (COC) is similar]. First, the microinjection pipette should be close to, instead of pressing, the zona pellucida, and then a small piezoelectric pulse was used to incompletely penetrate the zona pellucida. Finally, the microinjection needle with the incomplete zona pellucida and the cell membrane is inserted into 1/3 to 2/3 of the oocyte, and then the oil pressure microinjector is turned into a vomiting state, and a minimum amount of piezoelectric pulse is given at the same time. (B) Microinjection diagram of fertilized eggs (microinjection of MII oocytes, two- and four-cell stage embryos are similar). First, the microinjection pipette presses the zona pellucida, and then an intermediate piezoelectric pulse is used to completely penetrate the zona pellucida. Finally, the microinjection needle is inserted into 1/3 to 2/3 of the cell, and then the oil pressure microinjector enters the vomiting state, and the smallest amount of piezoelectric pulse is given at the same time.

