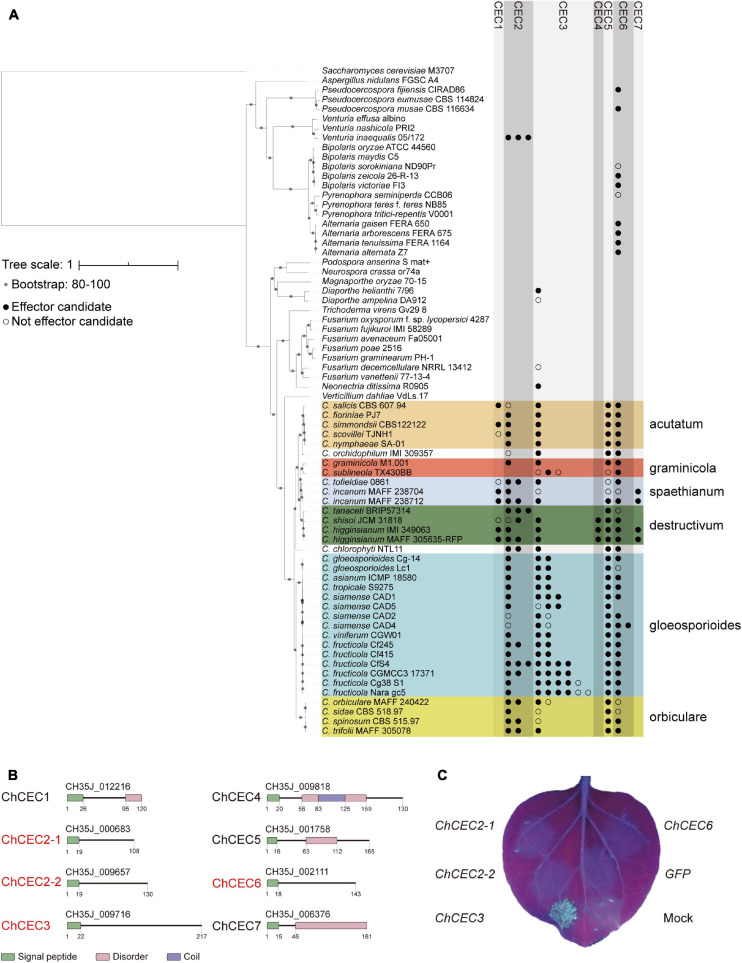
FIGURE 2.
(A) Conservation patterns of CEC genes examined using BLASTP. The maximum-likelihood species phylogeny was drawn based on the alignment patterns of single-copy orthologs obtained using OrthoFinder. Bootstrap values are based on 1,000 replicates. Colored boxes represent species complexes within the Colletotrichum genus. (B) Predicted functional domains of CEC proteins found in C. higginsianum MAFF 305635-RFP. Red letters indicate effector candidates that are up-regulated during infection as reported previously (O’Connell et al., 2012). (C) Representative cell death assay result using A. tumefaciens harboring pSfinx vectors. The image was taken 6 days after infiltration under UV illumination. No GFP fluorescence was visible, as it was weaker than fluorescence from dead leaf tissue.

