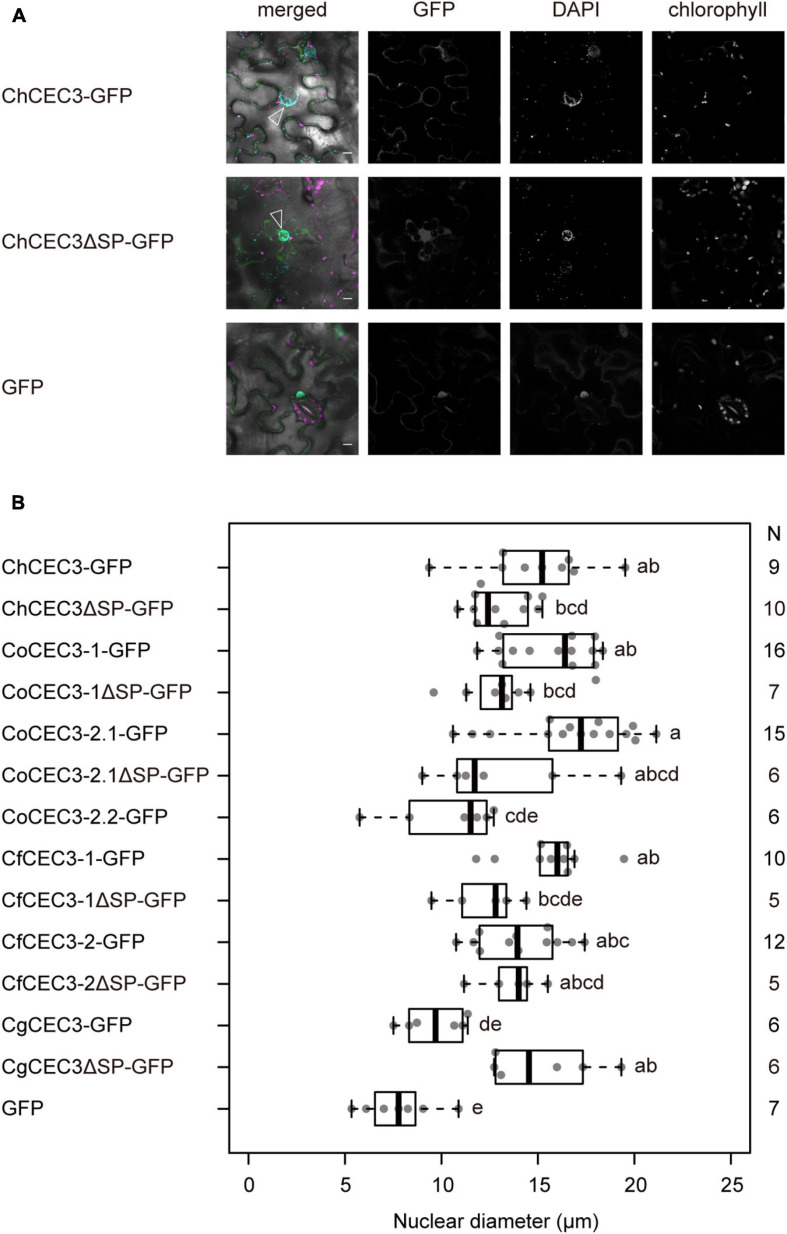
FIGURE 4.
(A) Transient expression of GFP-tagged ChCEC3 protein-induced nuclear expansion in N. benthamiana leaf cells. In merged images, green represents GFP signals, cyan represents DAPI signals, and magenta represents chlorophyll autofluorescence. Open arrowheads indicate expanded nuclei. Images were taken 24 h after infiltration. Bars = 10 μm. (B) Boxplots of nuclear diameters resulting from transient expression of GFP-tagged CEC3 proteins. Data represent the medians of biological replicates. N represents the number of nuclei examined. CoCEC3-2.2ΔSP-GFP is not included because no GFP signal was detected. Analysis of variance with Tukey post hoc honestly significant difference test (P < 0.05) was performed.

