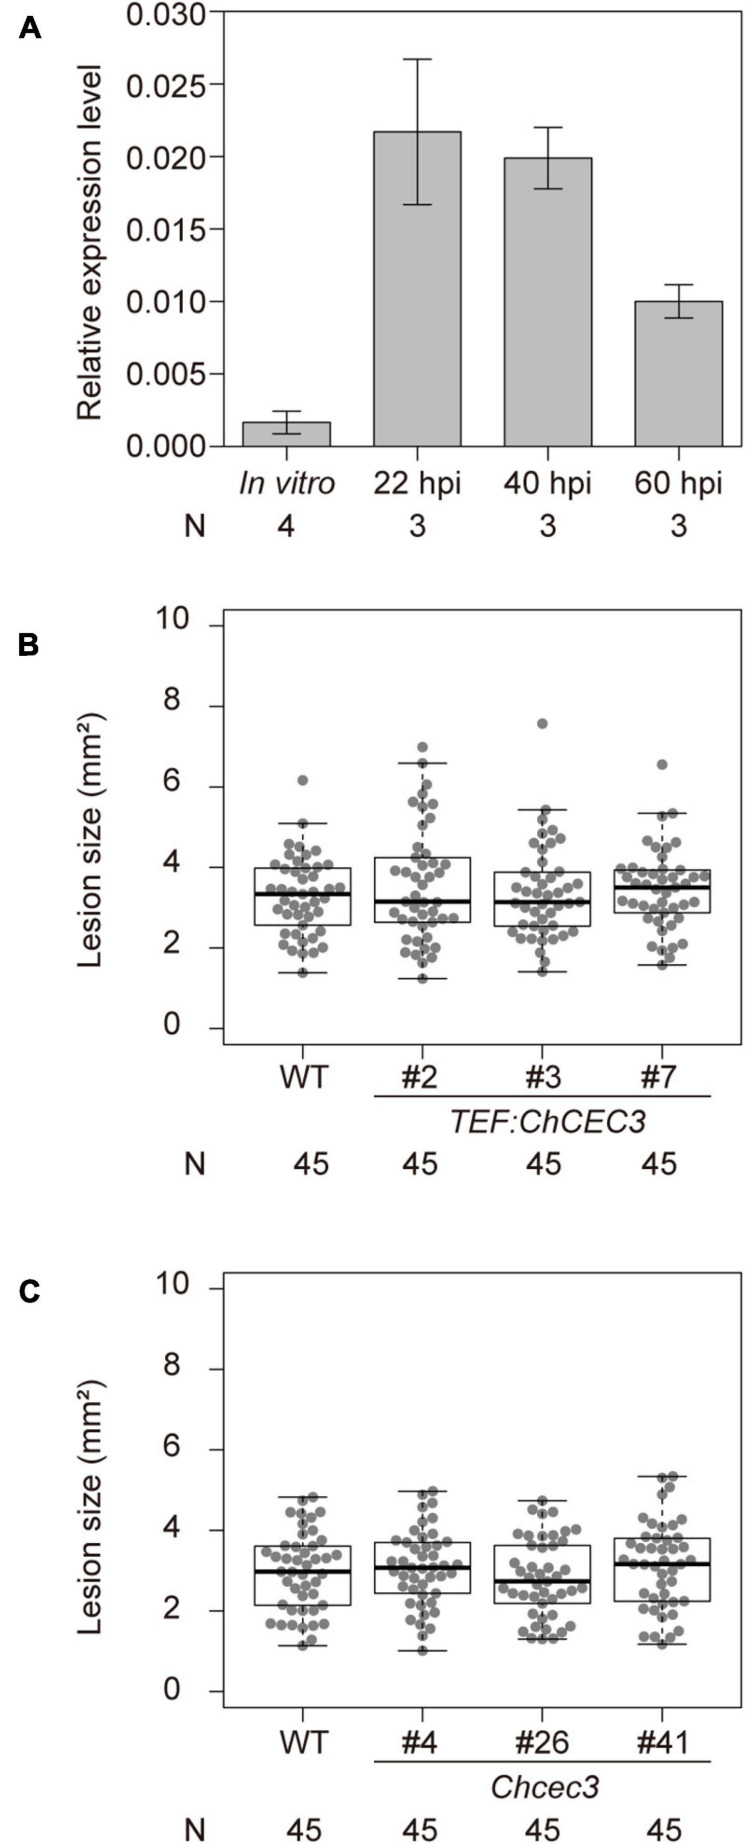
FIGURE 5.
(A) RT-qPCR analysis of ChCEC3 transcript levels in hyphae in vitro versus in planta infection time course. 22, 40, and 60 h post inoculation (hpi) correspond to the pre-penetration stage, the early biotrophic stage, and the transition to necrotrophic stage, respectively. ChCEC3 transcript levels were normalized against ChTubulin. Data represent the means of biological replicates. Error bars indicate standard error of the mean. N represents the number of biological replicates. (B,C) Boxplots of lesion area assays using ChCEC3 overexpressors and knock-out mutants. For lesion area assays, A. thaliana ecotype Col-0 was inoculated with C. higginsianum strains. Symptoms were observed 6 days after inoculation. Data represent the medians of biological replicates. N represents the number of biological replicates. Analysis of variance with Tukey post hoc honestly significant difference test (P < 0.05) was performed. The experiments were repeated three times with similar results.

