
FIGURE 1.
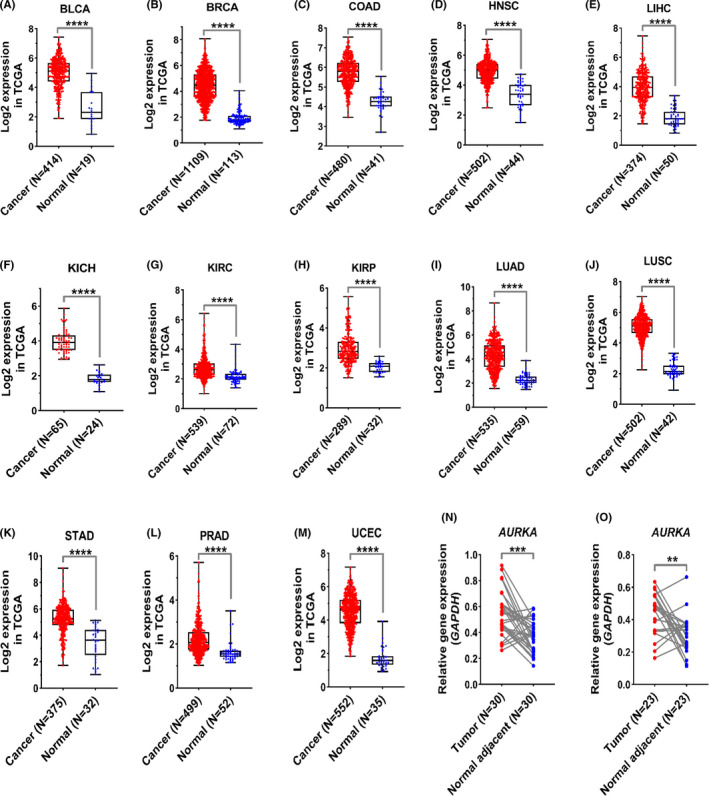
AURKA indicated significant upregulation in prevalent cancers compared to normal tissue. (A–M) The expression levels of AURKA in 13 prevalent cancers are shown based on TCGA data. The normalized data and logarithmic scale based on 2 were used to draw graphs. (N–O) RT‐qPCR data are shown for CRC and GC specimens. Relative expression levels were shown according to 2−Δct. Data were presented as means ± SD of three independent replicates of experiments (****p < 0.0001, ***p < 0.001, **p < 0.01)