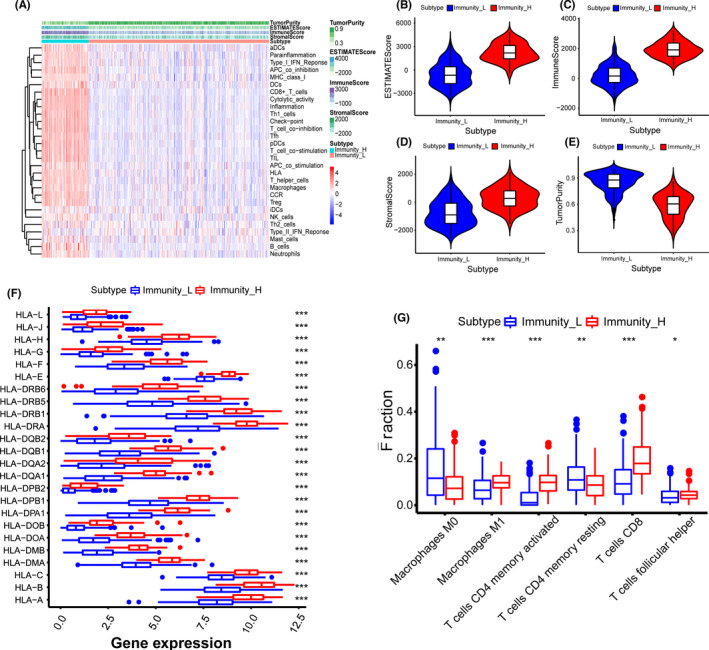
FIGURE 2.

Establishment and verification of bladder cancer grouping. (A) The heatmap showed the unsupervised clustering of 29 immune cells in the high immune cell infiltration group (Immunity_H) and the low immune cell infiltration group (Immunity_L). Parameters including the tumor purity, ESTIMATE score, immune score, and stromal score were also displayed. (B–E) The box plots revealed the statistical differences in tumor purity, ESTIMATE score, immune score, and stromal score between the high and the low immune cell infiltration groups. (F) The expression of human leukocyte antigen (HLA) family genes in the high immune cell infiltration group was higher than that in the low immune cell infiltration group. (G) The CIBERSORT method demonstrated that a higher density of immune cells was found in the high immune cell infiltration group compared to the low immune cell infiltration group. *p < 0.05; **p < 0.01; ***p < 0.001
