
FIGURE 7.
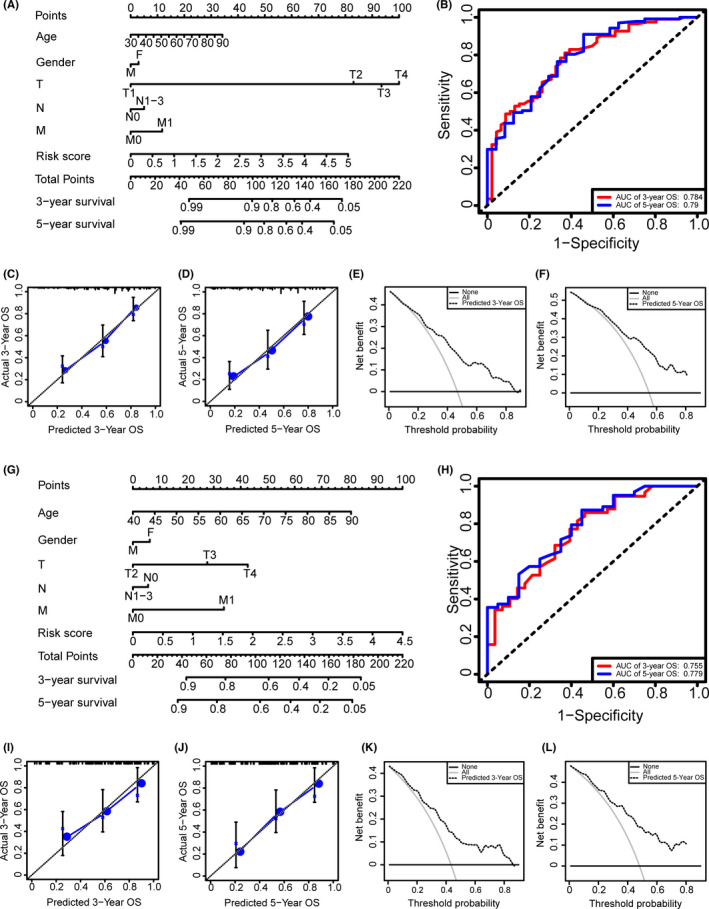
Establishment and evaluation of the prognostic model. (A, G) The nomograms for predicting the patients' overall survival (OS) in training and testing data sets, respectively. (B, H) ROC curve analysis showed that area under the curves (AUCs) of 3‐ and 5‐year OS were 0.784 and 0.790, respectively, in the training data set, and AUCs of 3‐ and 5‐year OS were 0.755 and 0.779, respectively, in the testing data set. (C, I) The calibration curves for 3‐year OS of the nomogram in training and testing data sets, respectively. (D, J) The calibration curves for 5‐year OS of the nomogram in training and testing data sets, respectively. (E, K) The DCA for 3‐year OS of the nomogram in training and testing data sets, respectively. (F, L) The DCA of 5‐year OS of the nomogram in training and testing data sets, respectively