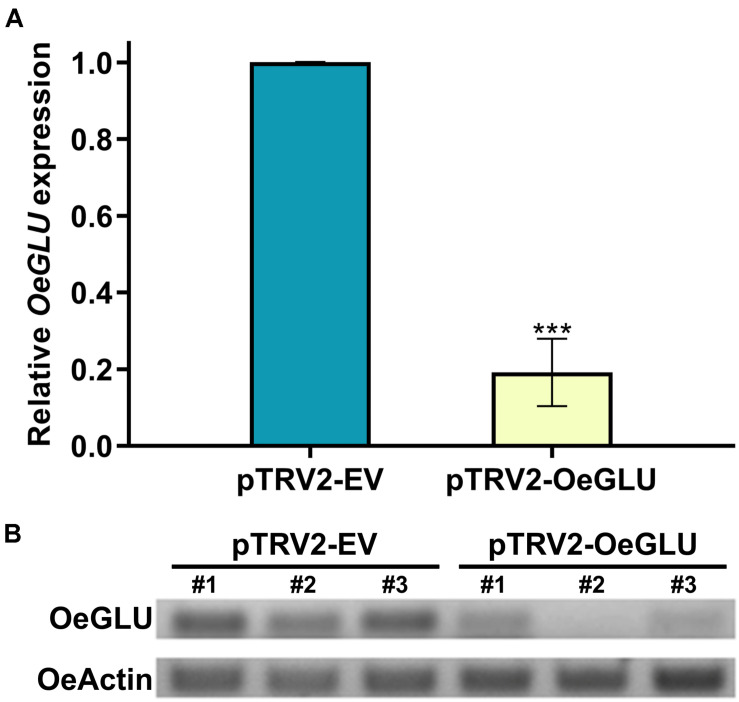
FIGURE 2.
VIGS-mediated silencing of OeGLU in olive plants. Real Time quantitative PCR (RT-PCR) (A) and semi-quantitative RT-PCR (B) analysis of OeGLU expression level of plants Agroinoculated with either pTRV2-EV or pTRV2-OeGLU constructs. OeActin was used as an internal control to normalize the samples. Three technical replicates of three biological replicates per treatment (A) or three biological replicates per treatment (B) were analyzed. Mean ± SE and asterisks denote statistical significance (***P ≤ 0.001; Student’s t-test). Numbers indicate biological replicates. EV, empty vector; OeGLU, oleuropein β-glucosidase.

