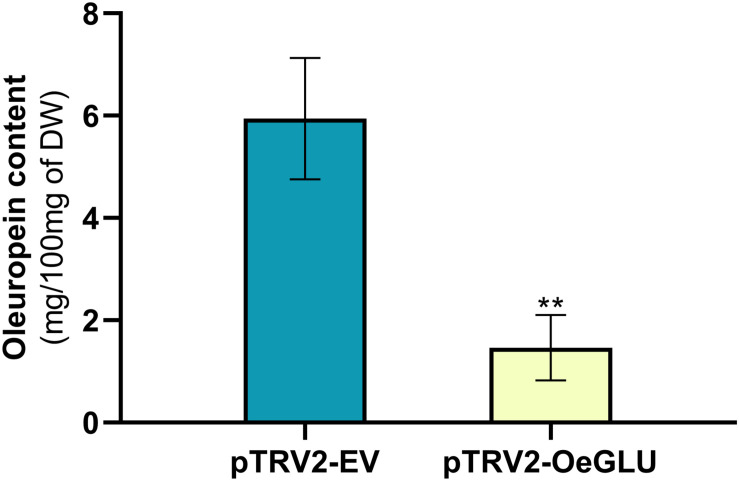
FIGURE 4.
Oleuropein content (mg) per 100 mg (dry weight) of olive leaves. Olive plantlets Agroinoculated either with pTRV2-EV (n = 3) or with pTRV2-OeGLU (n = 6) constructs were screened (Supplementary Table 2). Mean ± SE and asterisks denote statistical significance (**P ≤ 0.01; Student’s t-test). EV, empty vector; OeGLU, oleuropein β-glucosidase.

