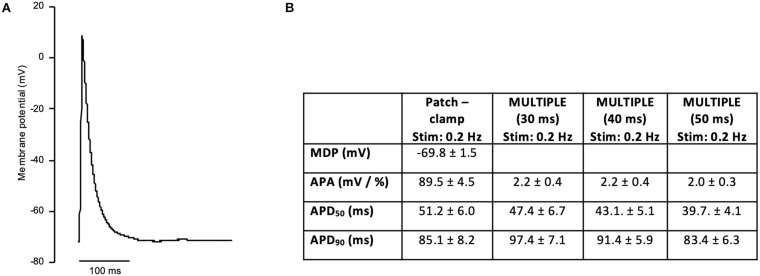
FIGURE 7.
Patch-clamp recording of AP in HL-1 cells. (A) Representative AP recording on a HL-1 cells using single cell patch-clamp (whole-cell configuration). APs were elicited at 0.2 Hz in current-clamp mode. (B) Table reporting average ± standard error of maximal diastolic potential (MDP), APA, APD50, and APD90 measured in patch-clamp cells (number of cells = 15). APA, APD50, and APD90 measured with MULTIPLE (pulses duration of 30, 40, and 50 ms) at the same stimulation frequency (0.2 Hz) are reported for direct comparison.

