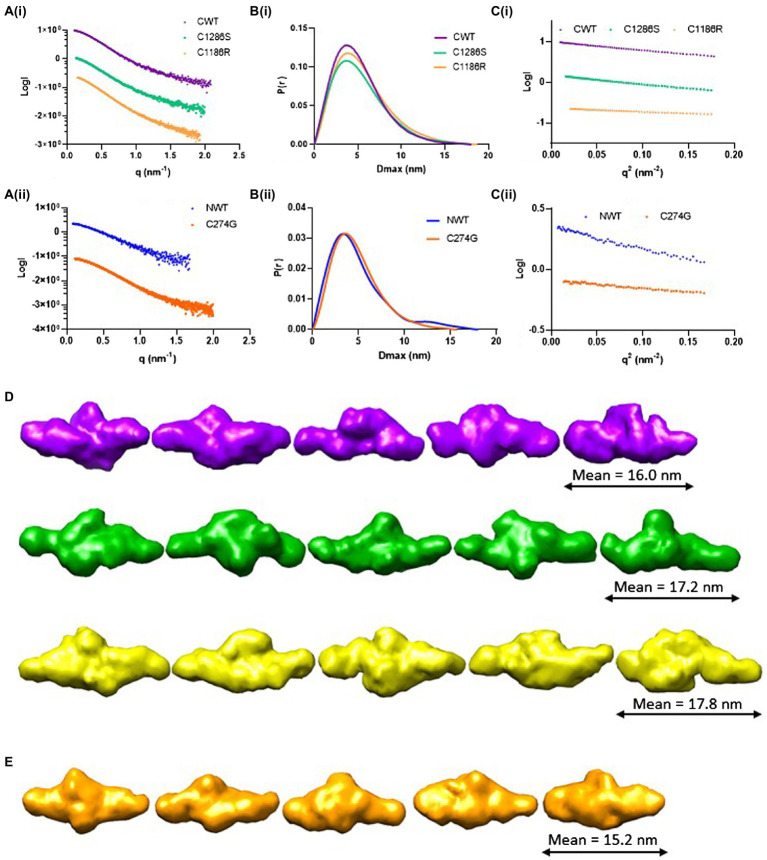
Figure 3.
Structural characterisation of LTBP4 N- and C-terminal regions using small angle X-ray scattering. (A) The experimental 1D scattering intensity I plotted as a function of q for (i) CWT, C1286S and C1186R, and (ii) NWT and C274G constructs used for analysis and modelling. (B) The IFT of I vs. q using GNOM, P(r) vs. r for wild type and mutants indicate the maximum dimensions in real space. (C) Guinier plot of the low q region for the (i) CWT, C1286S and C1186R and (ii) NWT and C274G showing linearity. (D) Five example ab initio models generated by DAMMIN are shown each for CWT (purple), C1286S (green) and C1186R (gold) and (E) C274G (orange). Models are shown to the same scale and the average end-to-end length is indicated for each construct.

