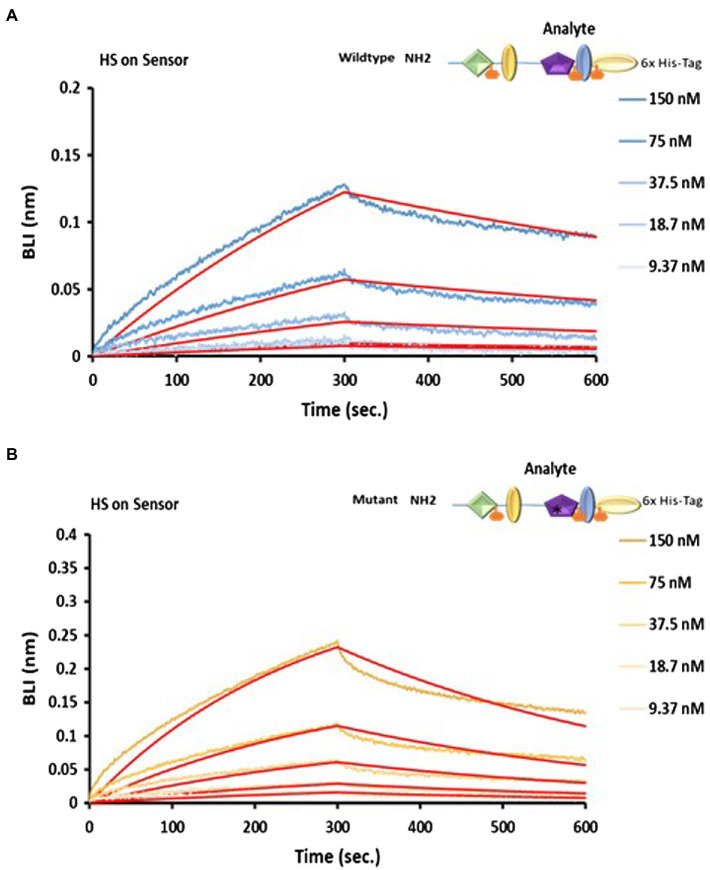
Figure 7.
Analysis of LTBP4 N-terminal interaction with fibronectin and HS using BLI. OctetRED sensorgrams showing both (A) the wild type and (B) mutant N-terminal region at a range of concentrations (150–9.37 nm) bind to immobilised heparin. The binding affinity KD was 52.6 nm for the wild type and 53.4 nm for the mutant, determined by fitting to a 1:1 Langmuir binding model (red curves). All experiments were performed in at least duplicate and representative results are shown.

