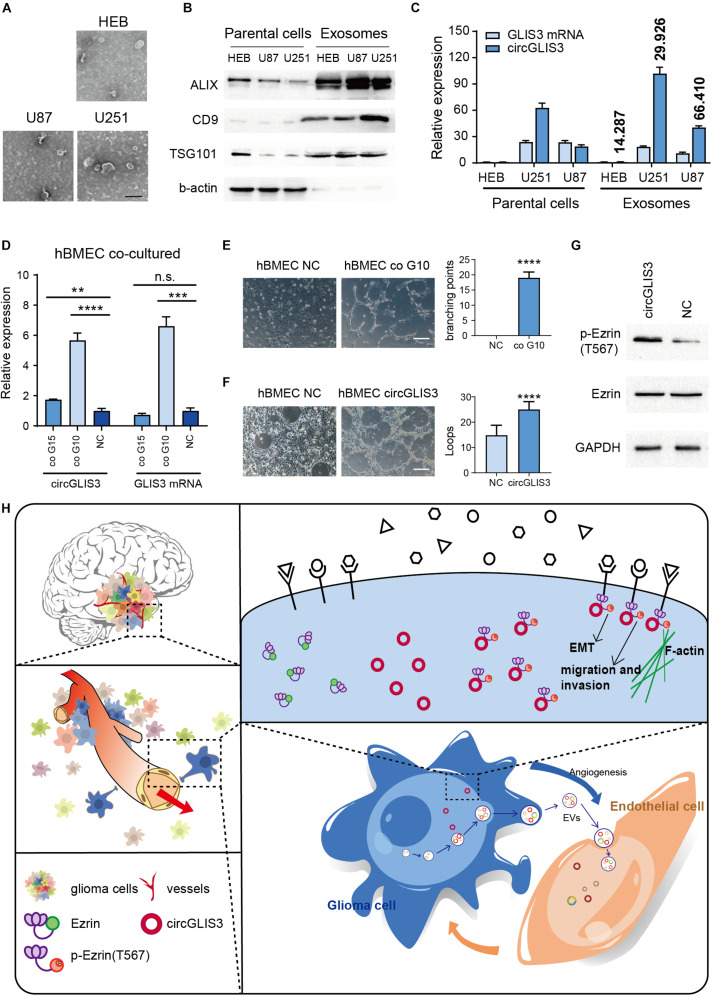
FIGURE 5.
CircGLIS3 is secreted into the microenvironment and participates in tumor angiogenesis. (A) Electron microscopy images of exosomes isolated from HEB, U87, and U251 cell culture supernatant (scale bar, 200 nm). (B) Western blot of exosomal markers and b-actin control in HEB, U87, and U251 cells and exosomes. (C) RT-PCR for the level of circGLIS3 and its linear counterparts in HEB, U87, and U251 cells (left) and corresponding exosomes (right); data were normalized to GAPDH. Fold enrichment of circGLIS3 compared to GLIS3 mRNA in each cell line is calculated according to 2–ΔΔCT and shown above the column. (D) RT-PCR of hBMEC after being cocultured with G15 and G10 for 5 days. Cells were cultured by a 1:1 mixture of primary glioma cell culture medium and ECM medium. (E) Tube formation assay of 3 × 10⁵ hBMEC in a 24-well plate after being cocultured with G10 for 7 days (upper) or (F) after being transfected with circGLIS3 plasmid (300 ng/ml) for 48 h (lower) (scale bar, 150 μm). (G) Western blot of p-Ezrin(567) and Ezrin in hBMEC after transfected with the circGLIS3 plasmid for 48 h. (H) Diagram of circGLIS3 in glioma progression. The results are presented as the mean ± SEM of biological triplicate assays. **P < 0.01, ***P < 0.001, ****P < 0.0001.

