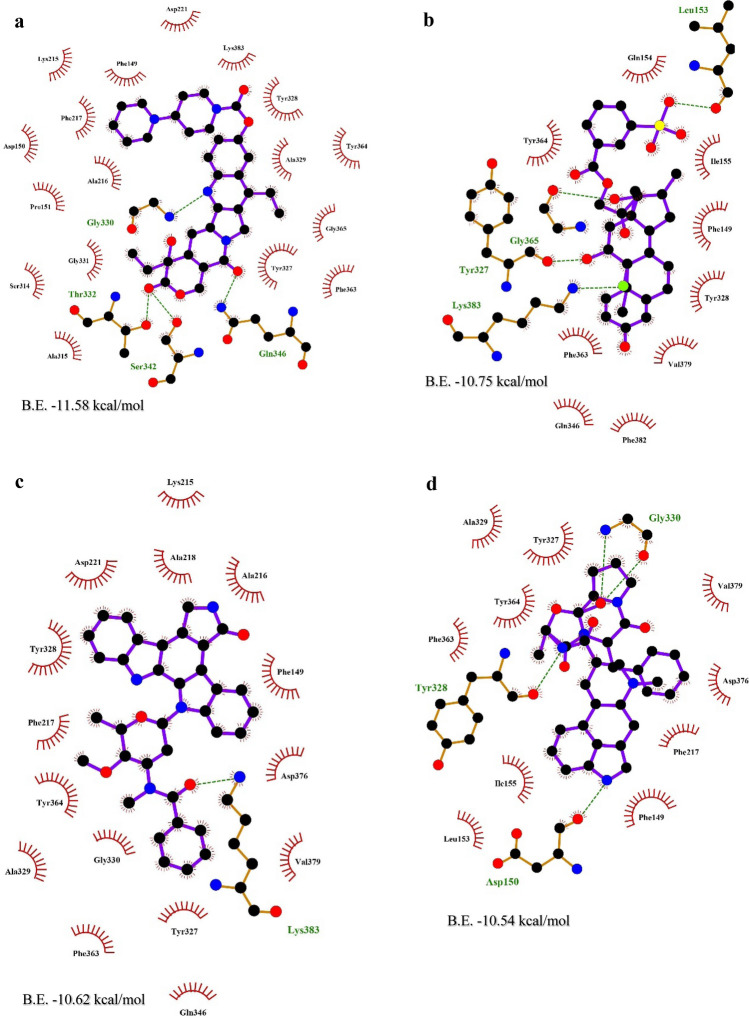
Fig. 5.
Visual representation of hydrogen bonds and hydrophobic interactions of selected drug compounds with FemA protein using LigPlot+. a Irinotecan. b Dexamethasone metasulfobenzoate. c Midostaurin. d Ergotamine. The olive green dotted lines represent the hydrogen bond, whereas brick red stellations correspond to the hydrophobic interactions. Olive green labelled amino acids involve hydrogen bonding and amino acids with brick red stellations representing the hydrophobic interacting residues in respective ligand–receptor connection surfaces (Color figure online)

