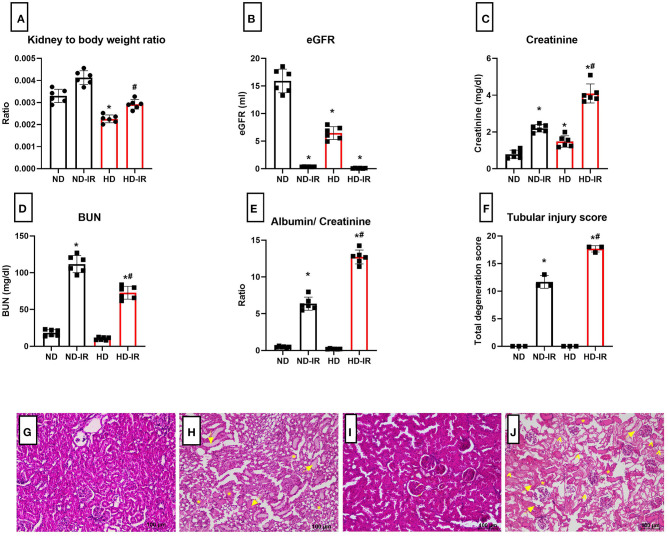
Figure 2.
Renal physiology and biochemistry analysis of ND and HD rats subjected to IR (A) kidney to body weight ratio, (B) eGFR, (C) plasma creatinine, (D) plasma BUN, (E) urinary albumin/creatinine ratio, and (F) renal injury score from (H,E) staining. *p < 0.05 vs. ND, #p < 0.05 vs. ND-IR. The data are presented as mean ± SD (n = 6/group). H&E stained images for ND and HD renal tissue subjected to IR injury (G) ND, (H) ND-IR, (I) HD, and (J) HD-IR (n = 3/group). The images are presented at 10x magnification. *Indicates tubular cast formation, arrow indicates extensive tubular dilatation, and arrow head indicates tubular necrosis. ND, Normal diet fed; FD, High fat diet fed; IR, Ischemia-reperfusion.

