Figure 2.
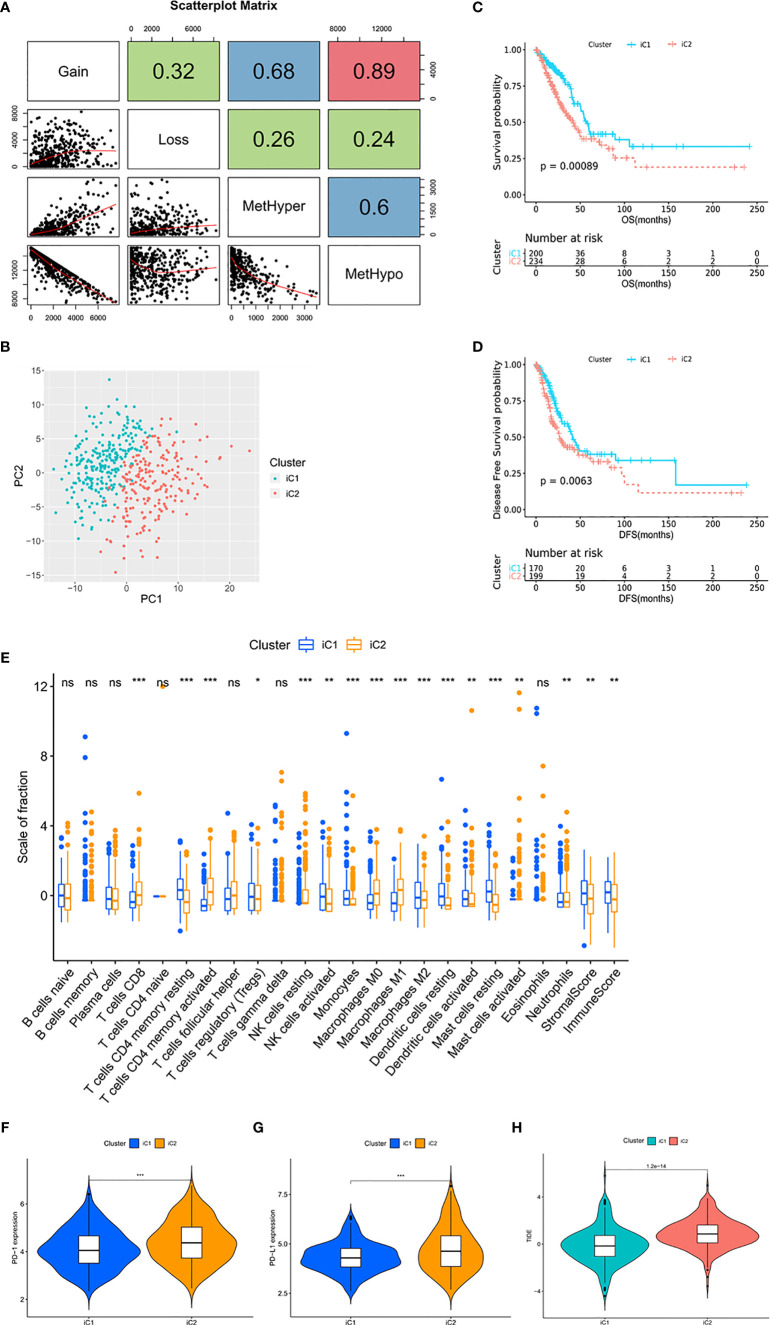
Multi-omics data identified molecular subtypes with distinct TIME. (A) Scatter distribution of MetHyper/MetHypo/gain/loss frequencies from samples. The number in the box represents the correlation coefficient of the corresponding position; each dot represents a sample. The Spearman method was used to calculate the correlation; p < 0.001. (B) The PCA of the two molecular subtypes. The green dots represent the patients in iC1 (n = 203). The red dots represent the patients in iC2 (n = 240). (C) Survival analysis with the Kaplan–Meier curve showed that the OS rate in iC1 was significantly higher than that in iC2 (p < 0.001); (D) the DFS rate in iC1 was significantly higher than that in iC2 (p = 0.0063). Significance was determined using the log-rank p test. (E) The fractions of 22 immune cell types, stromal score, and immune score in iC1 and iC2. (F, G) Expression level of (F) PD-1 and (G) PD-L1 in iC subtypes. (H) TIDE score in iC subtypes. *p < 0.05, **p < 0.01, and ***p < 0.001. ns, not statistically significant.

