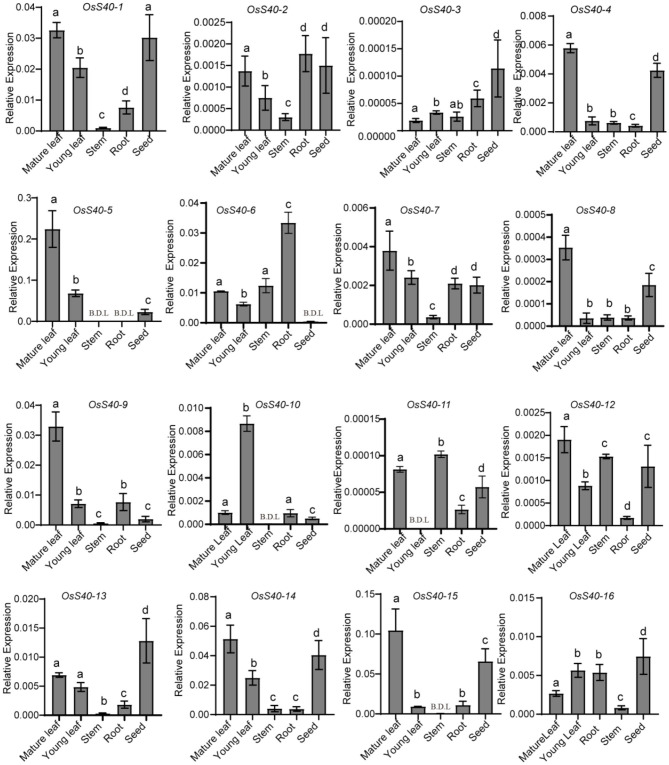
Figure 1.
Tissue-specific expression of the OsS40 gene family in rice. Transcript levels are expressed relative to rice OsACTIN in each sample, and values are mean ± SD. Mean and SD values were obtained from three biological replicates and three technical replicates. Statistically significant difference was determined using a one-way ANOVA test (p < 0.05). Groups carrying the same letter show no significant difference, while a significant difference is found between groups carrying the different letters of a, b, c, or d. B.D.L., below the detection limit.

