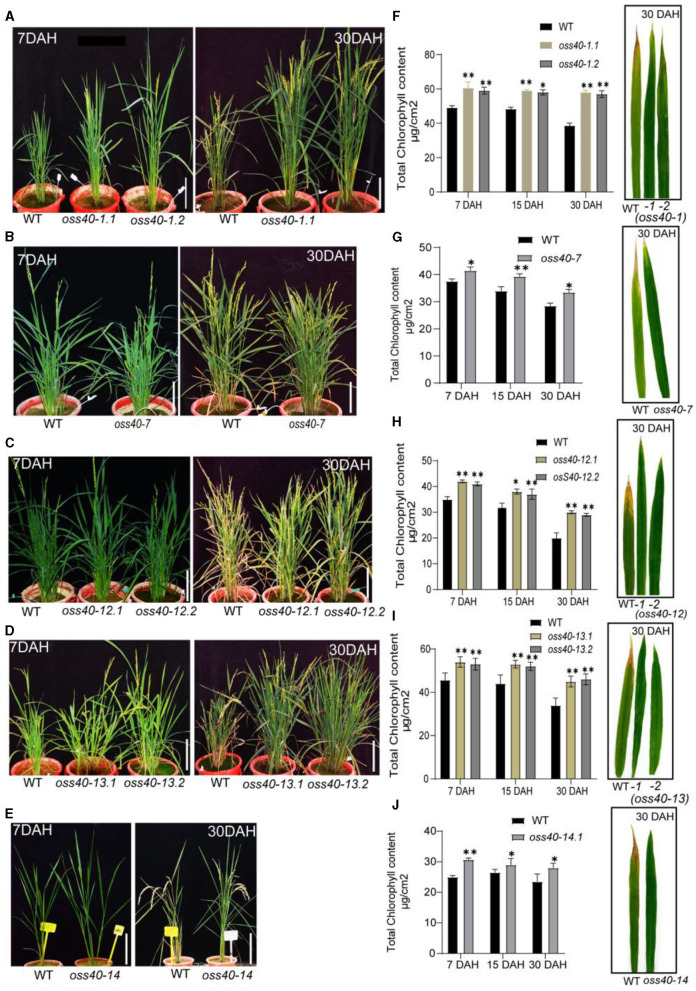
Figure 4.
The stay-green phenotype of different oss40 mutant lines during natural senescence. (A,C,E,G,I) represents the phenotype of WT and oss40 (−1, −7, −12, −13, and −14) mutants, respectively, at 7 DAH and 30 DAH (days after heading). (B,D,F,H,J) show total chlorophyll levels of WT and oss40 mutants at 7DAH, 15DAH, and 30DAH, respectively. Five flag leaves were used for chlorophyll content measurement. Mean and SD values were obtained from three biological replicates. Significant differences of the chlorophyll levels normalized to WT were evaluated using a paired Student's t-test (*p < 0.05; **p < 0.01).

