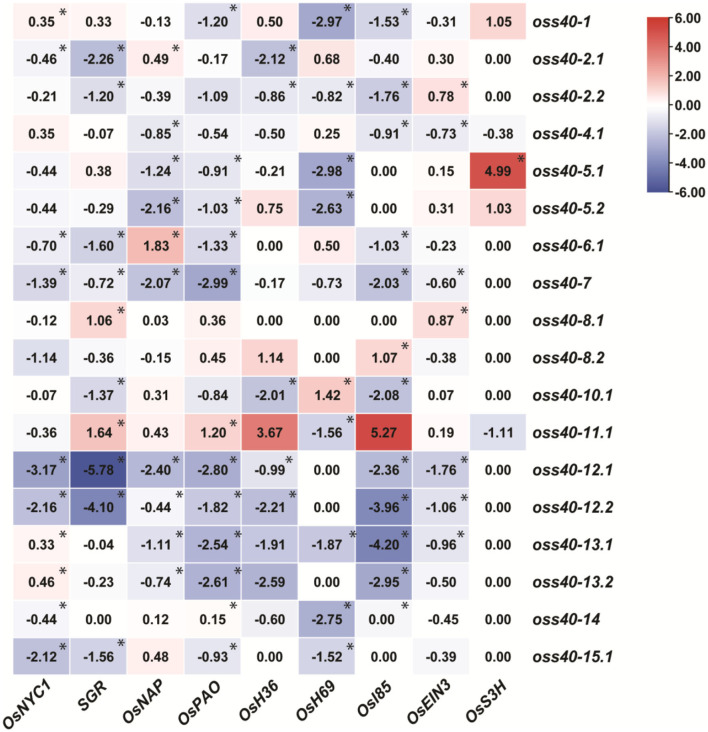
Figure 6.
Altered expression of CDGs and SAGs in different oss40 mutant lines. Heatmap representation shows the CDGs (OsNYC1, SGR, and OsPAO) and SAGs (OsH36, OsH69, Os185, OsNAP, OsEIN3, and OsS3H) expression level in different mutant lines. The expression levels of genes are presented using fold-change values log2 format. The data indicate the relative expression levels normalized to that of the internal control OsACTIN. Red and blue colors correspond to up- and down-regulation of the gene expressions, respectively. Mean and SD values were obtained from three biological replicates. Significant differences of the expression levels normalized to WT were evaluated using Student's t-test (*p < 0.05).

