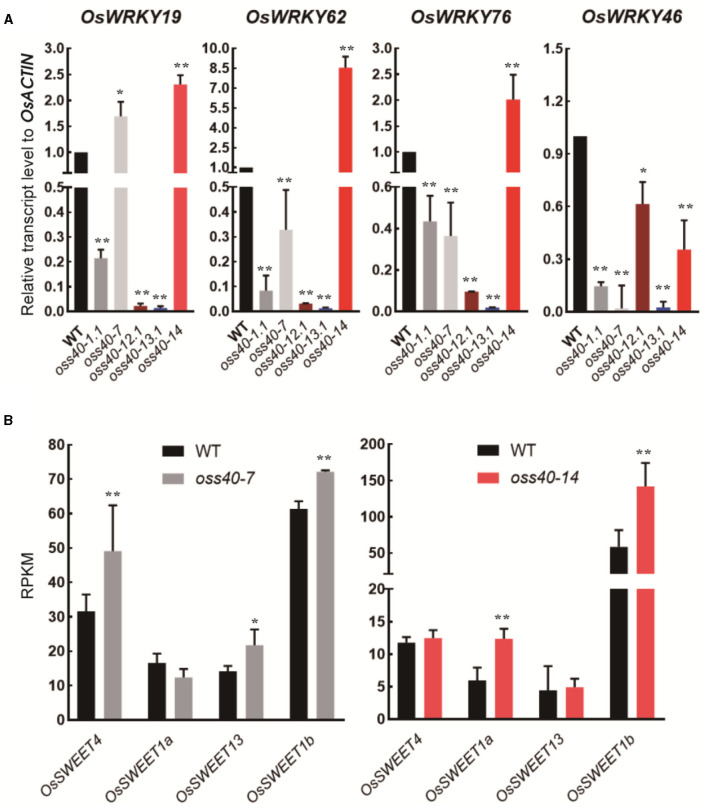
Figure 7.
Expression profiles of selected WRKY members and SWEET members in the stay-green oss40 mutants relative to WT (A). Expression profiles of selected WRKY members (OsWRKY19, OsWRKY62, OsWRKY76, and OsWRKY46) in five stay-green oss40 mutants relative to WT (B). Expression profiles (RPKM) of selected SWEET members (OsSWEET1a, OsSWEET1b, OsSWEET4, and OsSWEET13) in the oss40-7 and oss40-14 mutants relative to WT based on the RNA-seq dataset of mutant and WT leaves at 77 days after sowing. The values are mean ± SD. Mean and SD values were obtained from three biological replicates. Significant differences of the expression levels normalized to WT were evaluated using Student's t-test (*p < 0.05; **p < 0.01).

