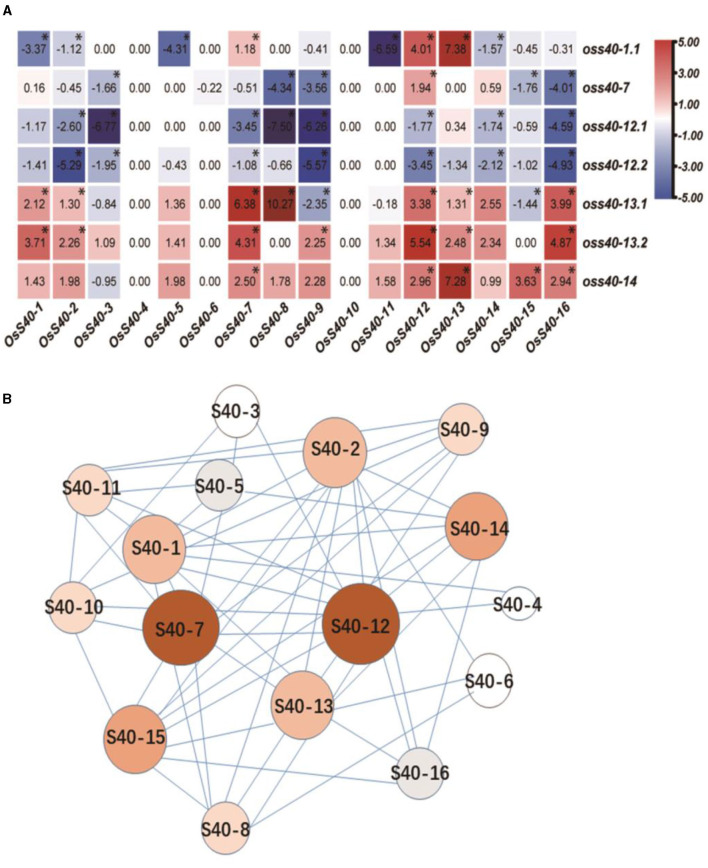
Figure 9.
The co-expression and regulatory network inside the S40 family. (A) Heatmap representation shows OsS40 expression levels in oss40 (−1, −7, −12, −13, and −14) mutant lines. The expression levels of genes are presented using fold-change values log2 format. The data indicate the relative expression levels normalized to that of the internal control OsACTIN. Red and blue colors correspond to up- and down-regulations of the gene expressions, respectively. Mean and SD values were obtained from three biological replicates. Significant differences of the expression levels normalized to WT were evaluated using Student's t-test (*p < 0.05). (B) Structure of the co-expression network in the S40 family. In this network, the red nodes represent more associations with other members; the white nodes represent fewer associations with other members, indicating the alteration of other member gene expression in one mutant.

