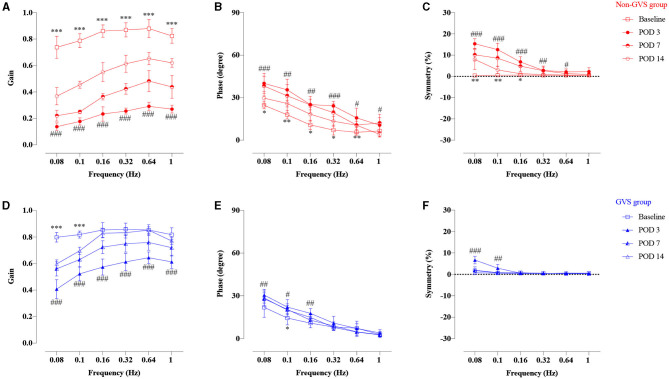
Figure 3.
Time course of the compensation process of VOR responses of gain, phase, and symmetry of the non-GVS group (A–C with red colors) and the GVS group (D–F with blue colors) compared to the baseline value. Marked VOR gain reduction was observed at all frequencies at POD 3 in the non-GVS group (###p < 0.001, paired t-test). Although the VOR gain increased considerably at POD 14, it still remained impaired at all frequencies compared to baseline value (***p < 0.001, paired t-test) (A). The phase and symmetry also gradually recovered over time up to POD 14, but they did not reach the values of the baseline (B,C). The GVS group also exhibited VOR gain reduction at all frequencies at POD 3 after applying three sessions of GVS compared to the baseline (###p < 0.0001, paired t-test) (D). However, the VOR gain was gradually recovered until POD 14 and nearly reached the value of the baseline, especially at high-frequency stimuli (D). The phase and asymmetry of VOR were fully compensated at POD 14, with the exception of the phase at 0.1 Hz (*p = 0.023, Wilcoxon signed rank test) (E,F). VOR, vestibulo-ocular reflex; GVS, galvanic vestibular stimulation; UL, unilateral labyrinthectomy; POD, postoperative day. *A significant difference between the values of the baseline and the values at POD 14; #A significant difference between the values of the baseline and the values at POD 3. *, # indicate p < 0.05; **, ## indicate p < 0.01; ***, ### indicate p < 0.001.

