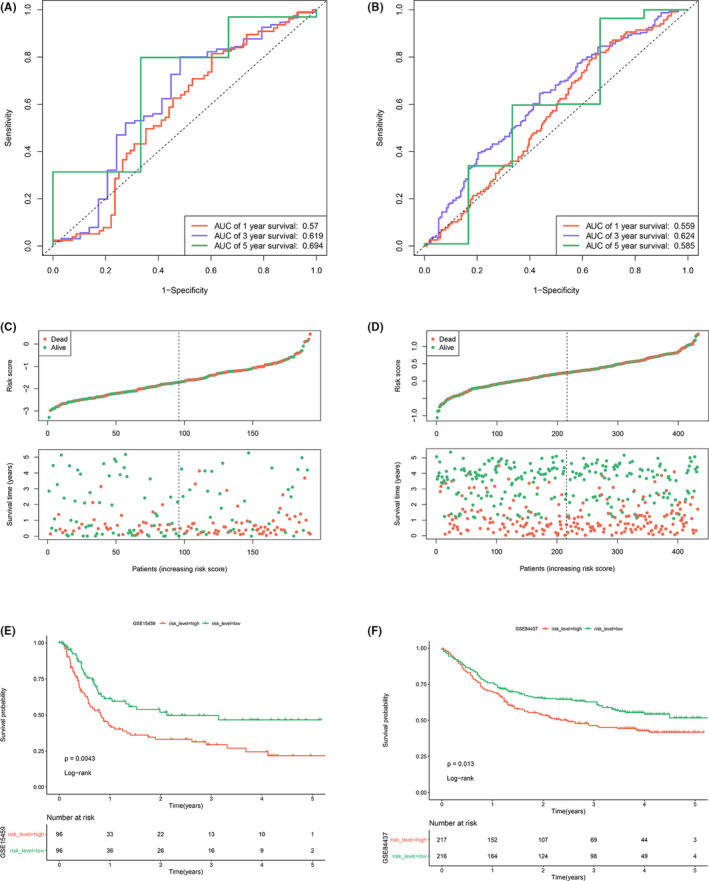
FIGURE 4.

Validation of the signature in two external datasets. (A) The time‐dependent ROC curve predicting the 1‐year, 3‐year, and 5‐year survival rates of GSE15459. (B) The time‐dependent ROC curve predicting the 1‐year, 3‐year, and 5‐year survival rates of GSE84437. (C) Distribution of RS and the relationship between OS and RS in GSE15459. (D) Distribution of RS and the relationship between OS and RS in GSE84437. (E) Kaplan–Meier curve analysis between the high RS and low RS groups of GSE15459. (F) Kaplan–Meier curve analysis between the high RS and low RS groups of GSE84437
