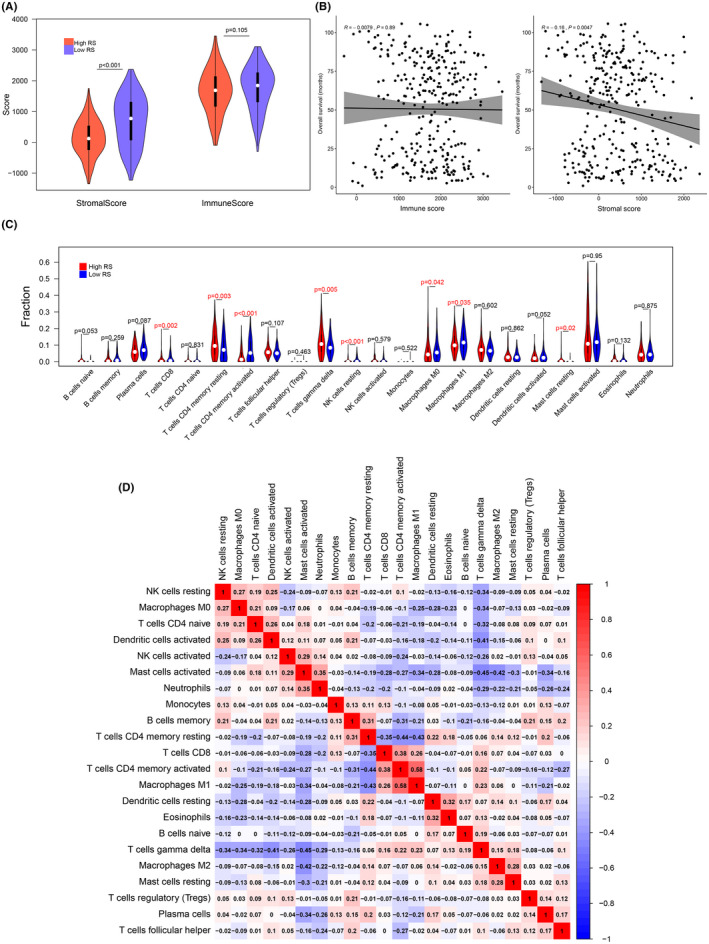
FIGURE 6.

Immune infiltration analysis. (A) The violin plot of the difference in stromal score and the immune score between high RS and low RS groups. (B), The correlation plots of the relationship of OS and the stromal score, along with the relationship of OS and the immune score. (C) The violin plot showed the difference in 22 immune infiltrating cells between high RS and low RS groups. (D) The correlation plots of the nine immune infiltrating cells related to RS
