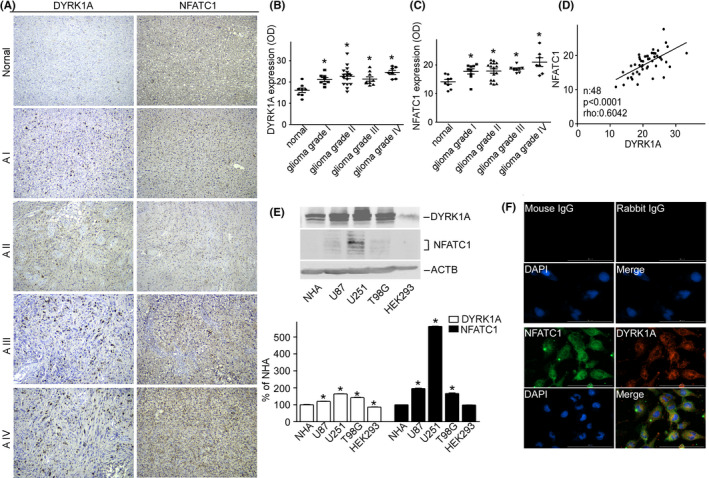
FIGURE 1.

DYRK1A and NFATC1 protein expression were coordinately increased in brain gliomas. A Representative images for the immunohistochemical staining of DYRK1A and NFATC1 in four different grades of gliomas and normal tissues. DYRK1A was detected using a polyclonal anti‐DYRK1A antibody (CST, #2771) and NFATC1 was detected using a monoclonal antibody (Thermo Fisher, #MA3‐024) in the microarray (Biomax, #GL481 and T173a). B. DYRK1A protein expression was increased in gliomas. The expression of DYRK1A was quantified by ImageJ software as described in the methods section. C. NFATC1 protein levels were increased in gliomas. The expression of NFATC1 was quantified by ImageJ software as described in the methods section. D. Correlation between protein levels of NFATC1 and DYRK1A in tissues was analyzed by Spearman's rank correlation test. p < 0.0001. rho = 0.0642. n=48. E. NFATC1 and DYRK1A were detected by WB in the cell lysate of NHA, U87, U251, T98G, and HEK293 cell lines. NFATC1 monoclonal antibody and DYRK1A polyclonal antibody were used as described in the methods section. F. Colocalization images for the immunofluorescent staining of DYRK1A and NFATC1 in U251 cells. DYRK1A was detected using a polyclonal anti‐DYRK1A antibody (CST, #2771), and NFATC1 was detected using a monoclonal antibody (Thermo Fisher, #MA3‐024), mouse IgG (Santa Cruz, sc‐2025), and rabbit IgG (Proteintech, B900610) as negative controls. Values represent means ±SD, n = 3.
