
Figure 5.
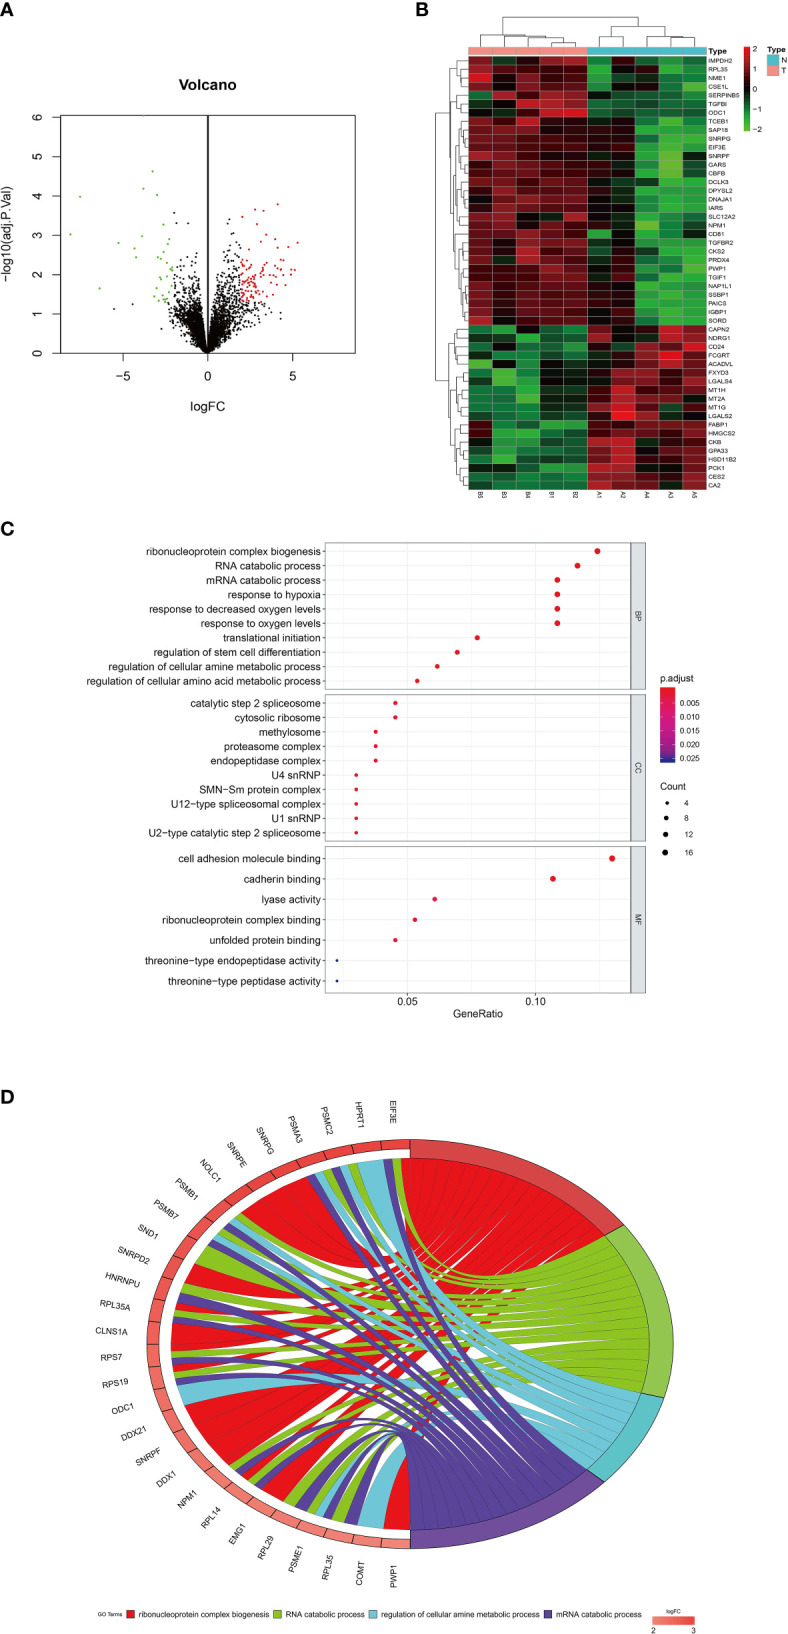
Dysregulated mRNAs by microarray analysis using colon tissues and GO analysis. (A) Volcano plot of the mRNAs. The red and green points represent differently expressed mRNAs (logFC > 2 or <−2 and adjust P value < 0.05). (B) Heatmap of differently expressed mRNAs (top 50). (C) Bubble and (D) circle plots by GO analysis with all the dysregulated genes. FC, fold change; GO, gene ontology; BP, biological processes; MF, molecular function; CC, cellular component.