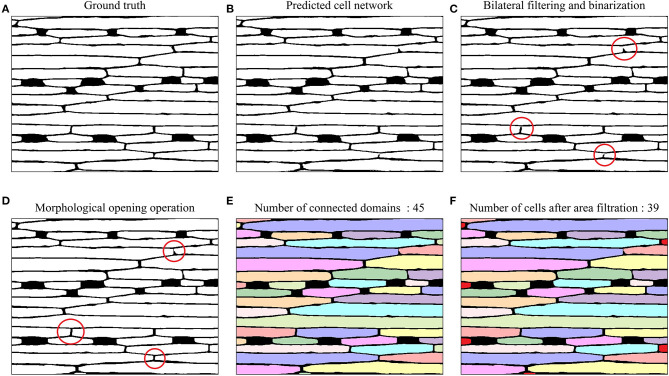
Figure 7.
Example images of epidermal cell segmentation by the U-Net-based model and morphological post-processing on a 20× magnified microscope image of the wheat leaf. (A) Ground truth. (B) Epidermal cell network predicted by U-Net. (C) Bilateral filtering and binarization; Red circles highlighted the breakpoints in the cell network. (D) Morphological opening operation; red circles highlighted connected breakpoints in the cell network after the morphological opening operation. (E) Connected domains with different colors (45 connected domains). (F) Epidermal cell counting after area filtering (39 epidermal cells). The six small connected domains that were filtered out were marked with red color.

