Figure 1.

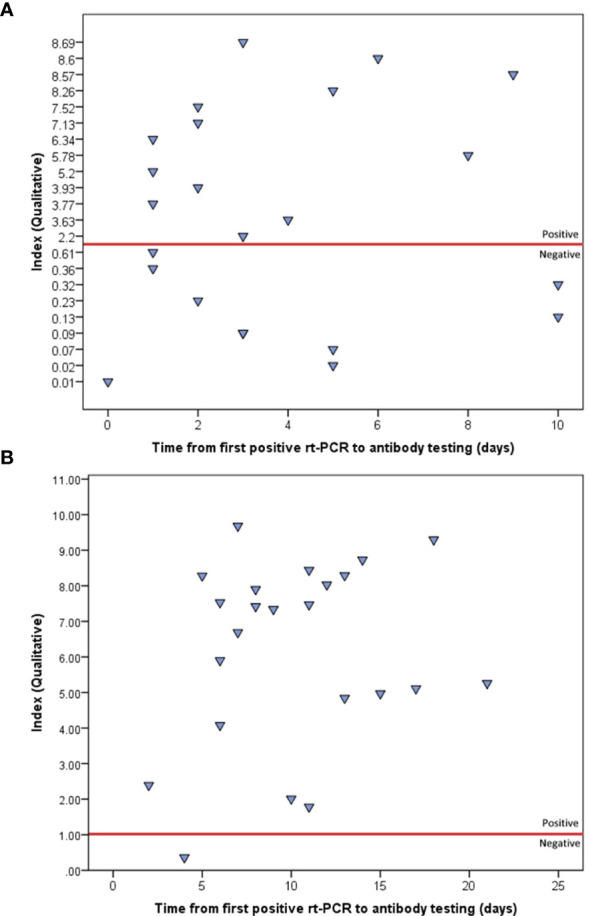
Indices of the first (A) and second (B) qualitative IgG testing, using ABBOTT method, as plotted by the time from first positive rt-PCR. The red line represents the positivity threshold (index>1).

Indices of the first (A) and second (B) qualitative IgG testing, using ABBOTT method, as plotted by the time from first positive rt-PCR. The red line represents the positivity threshold (index>1).