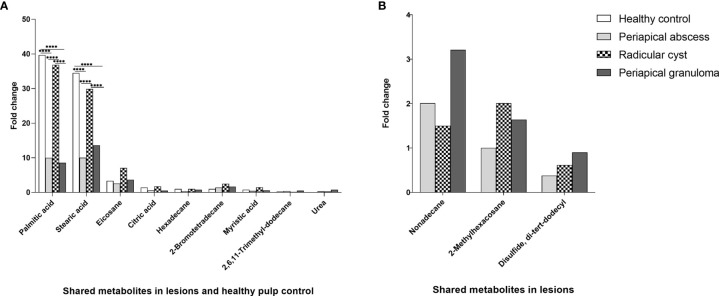
Figure 3.
Quantitative comparison of shared metabolites in periapical lesions and healthy control. The quantity of each metabolite was represented as the area under the peak of each metabolite in relation to the total areas of all other metabolites detected in an extract. The data displayed the fold change of area under the peak values of each metabolite in each group. The data were analyzed by two-way analysis of variance (ANOVA) using Tukey’s multiple comparisons test. P-value ≤ 0.05 was considered as significant. (A) Shared metabolites between periapical lesions and healthy control. Hexadecane in healthy control was regarded as one-fold and employed as a reference for the measurement of the other metabolites. (B) Shared metabolites between periapical lesions only. 2-Methylhexacosane in periapical abscess was used as a reference of one-fold for the measurement of metabolites in other lesions. **** reveals that P-value < 0.0001.

