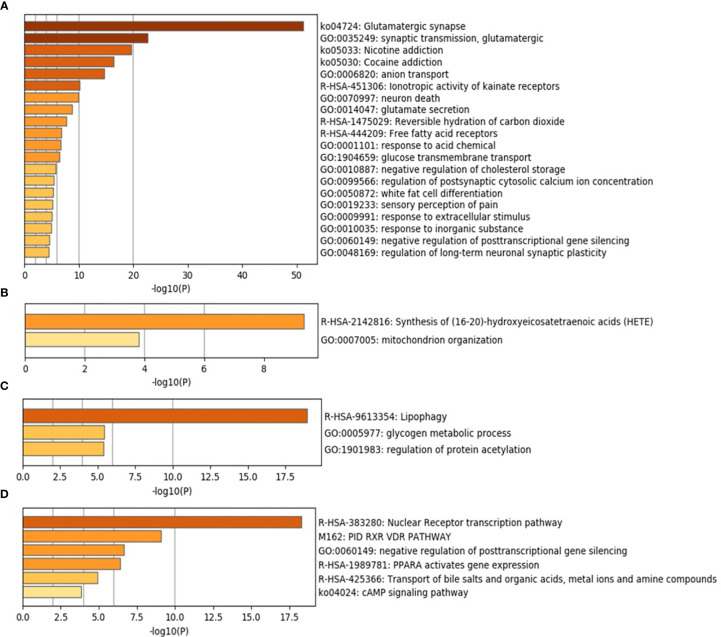
Figure 5.
Top 20 pathways and functional enrichment analysis using Metascape. The y-axis shows significantly enriched gene ontology terms of the target genes. The darker the color, the higher the gene counts included in that pathway. The x-axis shows the enrichment scores of the gene ontology terms. P-value is calculated according to the count of the provided genes found in the given pathway. Log10(P) is the P-value in log base 10. P-value ≤0.05 was considered as significant. (A) Healthy control. (B) Periapical abscess. (C) Radicular cyst. (D) Periapical granuloma.

