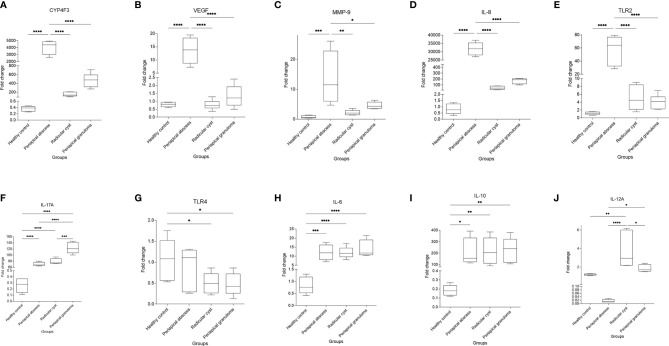
Figure 6.
Quantitative real-time PCR of selected genes identified in correlation to enriched pathways in periapical lesions compared with healthy control. Ten clinical samples in each group were investigated and each sample was replicated three times. The data display the fold change in gene expression between groups. The data were analyzed by one-way analysis of variance (ANOVA) using Tukey’s multiple comparisons test. P-value ≤0.05 was considered as significant. (A) CYP4F3. (B) VEGF. (C) MMP-9. (D) IL-8. (E) TLR2. (F) IL-17A. (G) TLR4. (H) IL-6. (I) IL-10. (J) IL-12A. * reveals that P-value < 0.05, ** reveals that P-value < 0.01, *** reveals that P-value < 0.001, **** reveals that P-value < 0.0001.

