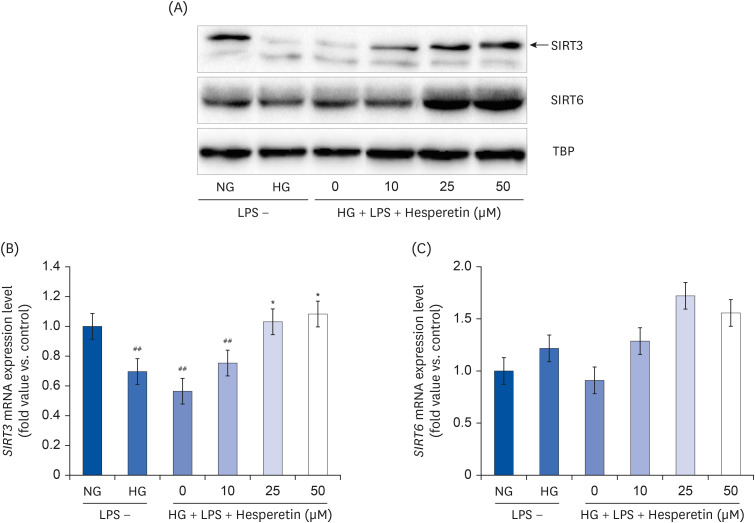
Fig. 5. Modulation of SIRT3 and SIRT6 protein expressions by hesperetin in LPS-treated THP-1 macrophages under hyperglycemic conditions. SIRT3 and SIRT6 protein levels were evaluated by western blot analysis and normalized to TBP (A). SIRT3 and SIRT6 mRNA levels were evaluated by quantitative polymerase chain reaction (B, C). The data are representative of at least three independent experiments. Data were analyzed using the 2−ΔΔCT method.
NG, normoglycemic 5.5 mM/L glucose; HG, hyperglycemic 25 mM/L glucose; LPS, lipopolysaccharide; H0, LPS + hyperglycemic + hesperetin 0 μM; TBP, TATA-binding protein.
##P < 0.01 compared with NG; *P < 0.01 compared with H0.

