
FIGURE 1.
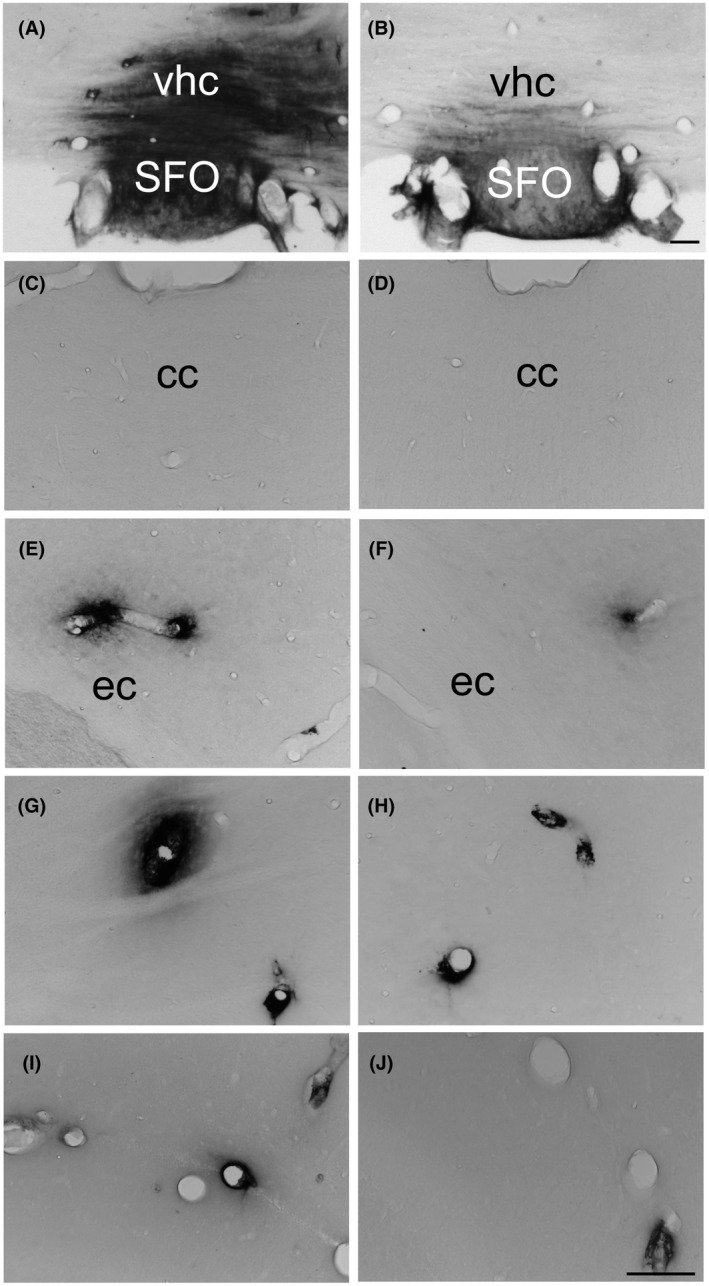
Photomicrographs illustrating the distribution of rat IgG‐immunoreactivity in the subfornical organ and ventral hippocampal commissure (A, B), the corpus callosum (C, D), external capsule (E, F), dorsolateral striatum (G, H) and hippocampus (I, J), 24 h after laparotomy (A, C, E, G, I) or cecal ligature and puncture (B, D, F, H, J) in rats that did not undergo MRI under isoflurane anesthesia. (For illustrations of IgG immunoreactivity in animals that underwent MRI under isoflurane anesthesia, see figure 6.15) cc: corpus callosum; ec: external capsule; vhc: ventral hippocampal commissure; SFO: subfornical organ. Arrow heads > and < indicate perivascular diffuse cloud‐like labeling Scale bar = 100 μm