
FIGURE 2.
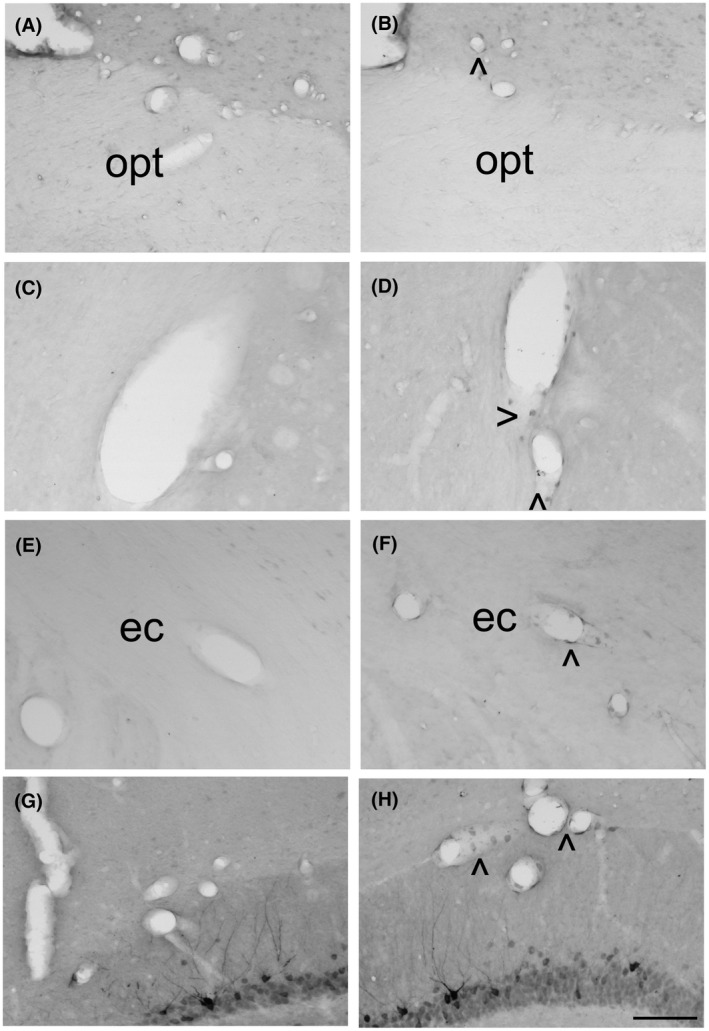
Photomicrographs illustrating the distribution of COX‐2‐immunoreactivity in the ventromedial preoptic area (A, B), caudate putamen (C, D), external capsule (E, F) and hippocampus (G, H) 24 h after laparotomy (A, C, E, G) or cecal ligature and puncture (B, D, F, H) in rats that did not undergo MRI under isoflurane anesthesia. (For illustrations of COX‐2‐immunoreactivity in animals that underwent MRI under isoflurane anesthesia, see figures 3 and 7 of Ref.[15) och: optic chiasm; ec: external capsule. Arrow heads > and < indicate labeling. Scale bar = 100 μm