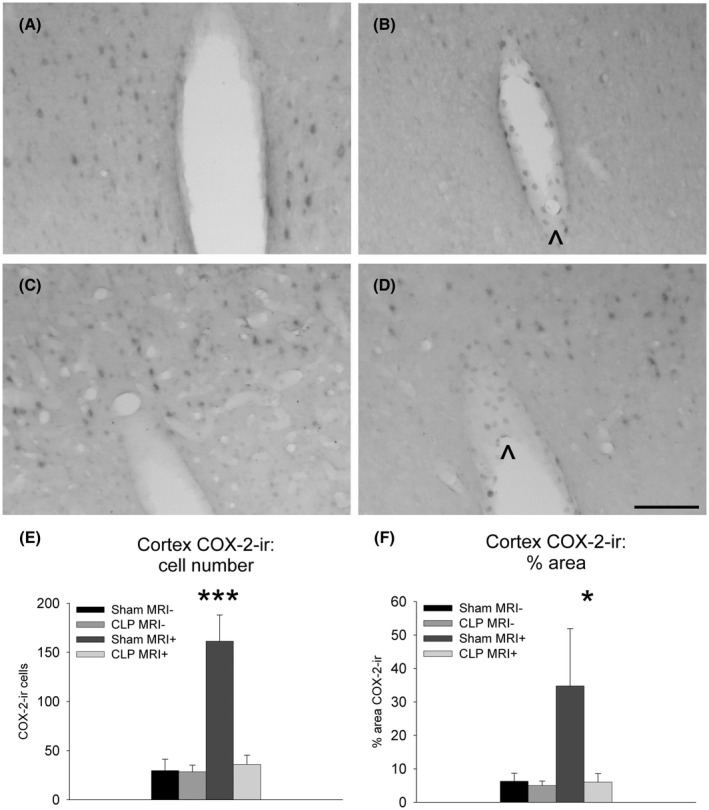
FIGURE 3.

Photomicrographs illustrating the distribution of COX‐2‐immunoreactivity in the cortex of rats that did not undergo MRI under isoflurane anesthesia (A, B) and of animals that were subject to MRI under anesthesia (C, D) 24 h after laparotomy (Sham: A, C) or cecal ligature and puncture (CLP: B, D). Scale bar = 100 μm. Quantification of cortical COX‐2‐immunoreactive cells (E) and surface (F) showing means ± SEM 24 h after cecal ligature (CLP) and puncture or laparotomy (Sham) in animal that underwent or not MRI under anesthesia (MRI±, respectively). ir: immunoreactivity *P < .05. ***P < .001. Group sizes Sham MRI−: n = 4; CLP MRI−: n = 5; Sham MRI+: n = 6; CLP MRI+: n = 7
